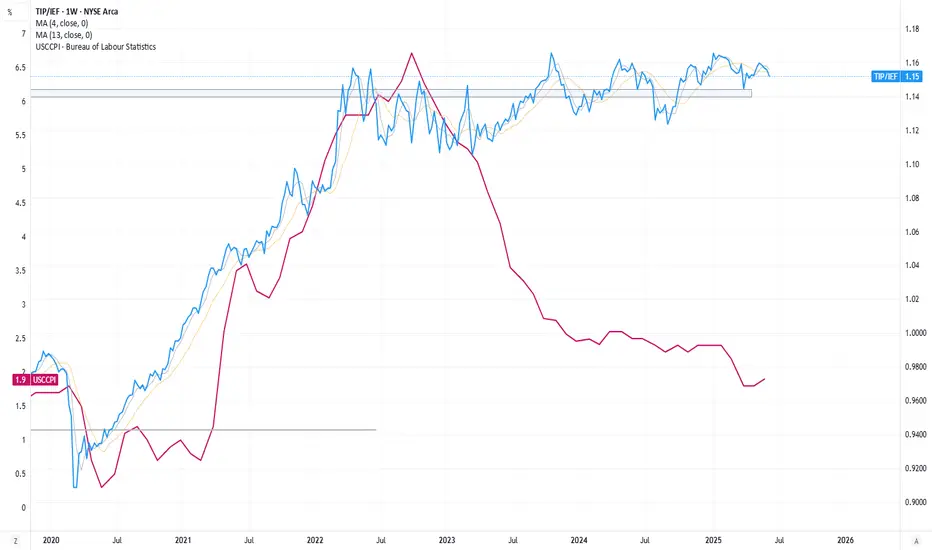
Bond Market - giving a warning sign?Typically, we would expect the TIP/IEF ratio to correlate with inflation. But that is NOT what we are seeing today. CPI is declining, but this ratio chart is implying that TLT is taking the brunt of it when compared to TIPS. This may be a warning signal that the bond market is discounting the of att
Key stats
About iShares TIPS Bond ETF
Home page
Inception date
Dec 4, 2003
Structure
Open-Ended Fund
Replication method
Physical
Dividend treatment
Distributes
Distribution tax treatment
Ordinary income
Income tax type
Capital Gains
Max ST capital gains rate
39.60%
Max LT capital gains rate
20.00%
Primary advisor
BlackRock Fund Advisors
Distributor
BlackRock Investments LLC
TIP, launched in late 2003, had a three-and-a-half-year head start to accumulate assets before its first ETF competitor stepped onto the TIPS scene. It seeks to track an index that holds a broad and diversified portfolio of TIPS with at least one year remaining in maturity. Securities included in the fund must be USD-denominated. These securities must also be issued by and backed by the full faith and credit of the US government. The underlying index uses market capitalization as its selection and weighting criteria. Prior to January 31, 2023, this fund tracked the Bloomberg U.S. Treasury Inflation Protected Securities (TIPS) Index.
Related funds
Classification
What's in the fund
Exposure type
Government
Stock breakdown by region
Top 10 holdings
Rising Inflation Expectations: TIP vs. IEFIntroduction:
With the election concluded, market focus has shifted to bond markets, where recent developments hint at rising inflation expectations. Despite President Trump's campaign emphasis on price control, indicators suggest a shift toward higher inflation. A key metric to monitor is the ratio

Inflation concerns lingering?One sign that the market may be turning skeptical on the battle against inflation is found within this chart. This chart plots the RELATIVE performance of TIPS against US Treasuries (as measured by NASDAQ:IEF ). While bond funds in general have been under pressure against stubbornly higher rates,

Tips Showing Clear Signs Of Bullish DivergenceTreasury Inflation Protected Securities are showing very clear divergence on the 2 week scale. Divergence of such are some of the most powerful signals that one can get especially on such a wide timeframe generally mean a shift in dynamics for quiet sometime. More so when concluding in bonds. As bon

QQQ still very elevated when compared to the TIPThe NASDAQ:QQQ typically trades with the AMEX:TIP over time, as the TIP represents real yields. With the TIP ETF falling, it would suggest the QQQ should be falling too, but that relationship has broken down over the past several weeks, suggesting one is likely wrong.

TIP off... Just want to show an anomaly observed here... sort of a tip off on what is most likely to happen.
You see, I read Russell Napier's Anatomy of the Bear back in 2009 (not easy to get it as it is out of print!), and he describes TIP as one of the/a leading indicator ahead of the equity market.
Superi

TIP off?Overlayed the TIP a chart with SPY (blue line). Quite clear that TIP (amongst JNK/HYG and even copper) precedes the index.
Given all previous analyses and outlook, what we would like to see is that TIP break out and above its trend line resistance, as does its VolDiv. When this happens, can expect

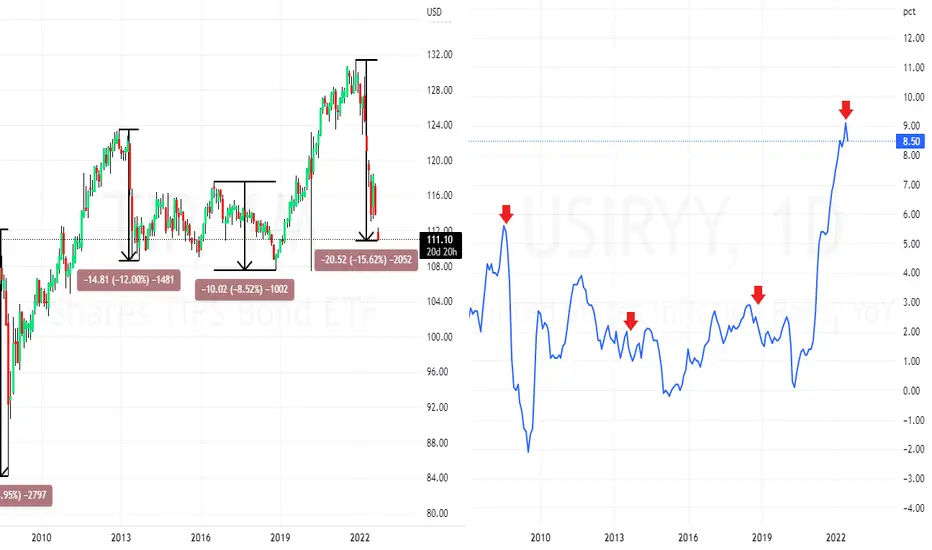
Inflation Protected Treasuries in free fallTips continuing to fall off a cliff. Almost as bad as gfc 2008.
Silent deflation.
#fintwit

Simple comparison between TIP and SPY - ominous lookingA simple comparison between TIP and SPY line charts. Had always known that TIP is one of the leading indicator for the S&P500 index (and ETF is SPY). Previous heads up shown with the lag denoted by the white boxes.
Key takeaway here is that TIP had went past the last low, and is pushing down lower,

Impact of TIPS on inflationHello friends.
There is an interesting correlation between the TIP ETF and inflation. TIPS stands for Treasury Inflation-Protected Security. These are fixed-income assets with a built-in hedge against inflation, so investors buy TIP when they expect high inflation and sell TIP when they expect low
See all ideas
Summarizing what the indicators are suggesting.
Oscillators
Neutral
SellBuy
Strong sellStrong buy
Strong sellSellNeutralBuyStrong buy
Oscillators
Neutral
SellBuy
Strong sellStrong buy
Strong sellSellNeutralBuyStrong buy
Summary
Neutral
SellBuy
Strong sellStrong buy
Strong sellSellNeutralBuyStrong buy
Summary
Neutral
SellBuy
Strong sellStrong buy
Strong sellSellNeutralBuyStrong buy
Summary
Neutral
SellBuy
Strong sellStrong buy
Strong sellSellNeutralBuyStrong buy
Moving Averages
Neutral
SellBuy
Strong sellStrong buy
Strong sellSellNeutralBuyStrong buy
Moving Averages
Neutral
SellBuy
Strong sellStrong buy
Strong sellSellNeutralBuyStrong buy
Displays a symbol's price movements over previous years to identify recurring trends.
Frequently Asked Questions
An exchange-traded fund (ETF) is a collection of assets (stocks, bonds, commodities, etc.) that track an underlying index and can be bought on an exchange like individual stocks.
TIP trades at 110.17 USD today, its price has risen 0.46% in the past 24 hours. Track more dynamics on TIP price chart.
TIP net asset value is 110.08 today — it's risen 0.71% over the past month. NAV represents the total value of the fund's assets less liabilities and serves as a gauge of the fund's performance.
TIP assets under management is 13.56 B USD. AUM is an important metric as it reflects the fund's size and can serve as a gauge of how successful the fund is in attracting investors, which, in its turn, can influence decision-making.
TIP price has risen by 0.66% over the last month, and its yearly performance shows a 1.83% increase. See more dynamics on TIP price chart.
NAV returns, another gauge of an ETF dynamics, have risen by 0.71% over the last month, showed a 1.86% increase in three-month performance and has increased by 4.52% in a year.
NAV returns, another gauge of an ETF dynamics, have risen by 0.71% over the last month, showed a 1.86% increase in three-month performance and has increased by 4.52% in a year.
TIP fund flows account for −4.94 B USD (1 year). Many traders use this metric to get insight into investors' sentiment and evaluate whether it's time to buy or sell the fund.
Since ETFs work like an individual stock, they can be bought and sold on exchanges (e.g. NASDAQ, NYSE, EURONEXT). As it happens with stocks, you need to select a brokerage to access trading. Explore our list of available brokers to find the one to help execute your strategies. Don't forget to do your research before getting to trading. Explore ETFs metrics in our ETF screener to find a reliable opportunity.
TIP invests in bonds. See more details in our Analysis section.
TIP expense ratio is 0.18%. It's an important metric for helping traders understand the fund's operating costs relative to assets and how expensive it would be to hold the fund.
No, TIP isn't leveraged, meaning it doesn't use borrowings or financial derivatives to magnify the performance of the underlying assets or index it follows.
In some ways, ETFs are safe investments, but in a broader sense, they're not safer than any other asset, so it's crucial to analyze a fund before investing. But if your research gives a vague answer, you can always refer to technical analysis.
Today, TIP technical analysis shows the strong buy rating and its 1-week rating is buy. Since market conditions are prone to changes, it's worth looking a bit further into the future — according to the 1-month rating TIP shows the buy signal. See more of TIP technicals for a more comprehensive analysis.
Today, TIP technical analysis shows the strong buy rating and its 1-week rating is buy. Since market conditions are prone to changes, it's worth looking a bit further into the future — according to the 1-month rating TIP shows the buy signal. See more of TIP technicals for a more comprehensive analysis.
Yes, TIP pays dividends to its holders with the dividend yield of 2.50%.
TIP trades at a premium (0.09%).
Premium/discount to NAV expresses the difference between the ETF’s price and its NAV value. A positive percentage indicates a premium, meaning the ETF trades at a higher price than the calculated NAV. Conversely, a negative percentage indicates a discount, suggesting the ETF trades at a lower price than NAV.
Premium/discount to NAV expresses the difference between the ETF’s price and its NAV value. A positive percentage indicates a premium, meaning the ETF trades at a higher price than the calculated NAV. Conversely, a negative percentage indicates a discount, suggesting the ETF trades at a lower price than NAV.
TIP shares are issued by BlackRock, Inc.
TIP follows the ICE US Treasury Inflation Linked Bond Index - Benchmark TR Gross. ETFs usually track some benchmark seeking to replicate its performance and guide asset selection and objectives.
The fund started trading on Dec 4, 2003.
The fund's management style is passive, meaning it's aiming to replicate the performance of the underlying index by holding assets in the same proportions as the index. The goal is to match the index's returns.