ABC BullishLeveraged so can go up a lot in a short time but can turn on you in a heart beat!
AB leg is often used to caculate targets..lenth of AB leg is added to long entry level using FIB levels. Long entry level is subjective but is when price breaks the BC leg in a clear uptrend.
Not a recommendation
N
Direxion Daily Robotics, Artificial Intelligence & Automation Index Bull 2X Shares
No trades
Key stats
About Direxion Daily Robotics, Artificial Intelligence & Automation Index Bull 2X Shares
Home page
Inception date
Apr 19, 2018
Structure
Open-Ended Fund
Replication method
Synthetic
Dividend treatment
Distributes
Distribution tax treatment
Ordinary income
Income tax type
Capital Gains
Max ST capital gains rate
39.60%
Max LT capital gains rate
20.00%
Primary advisor
Rafferty Asset Management LLC
Distributor
Foreside Fund Services LLC
UBOT offers leveraged exposure to firms developing and producing robots, automated products and services, and artificial intelligence. Selected companies must earn more than half their revenue from these activities, or demonstrate commitment to the space in other ways, such as investments or acquisitions. Its methodology also includes a 6% capping scheme per company at each semi-annual reconstitution. Unlike BOTZ, a Global X fund that tracks the same index, UBOT offers investors 2x leveraged exposure, rebalanced daily. As a levered product, the fund presents different risks than other types of funds and is thus not a buy-and-hold investment. It should not be expected to provide index leverage returns greater than a one-day period. Prior to October 30, 2020, the fund's leverage factor was daily 3x exposure.
Related funds
Classification
What's in the fund
Exposure type
ETF
Cash
Stock breakdown by region
Top 10 holdings

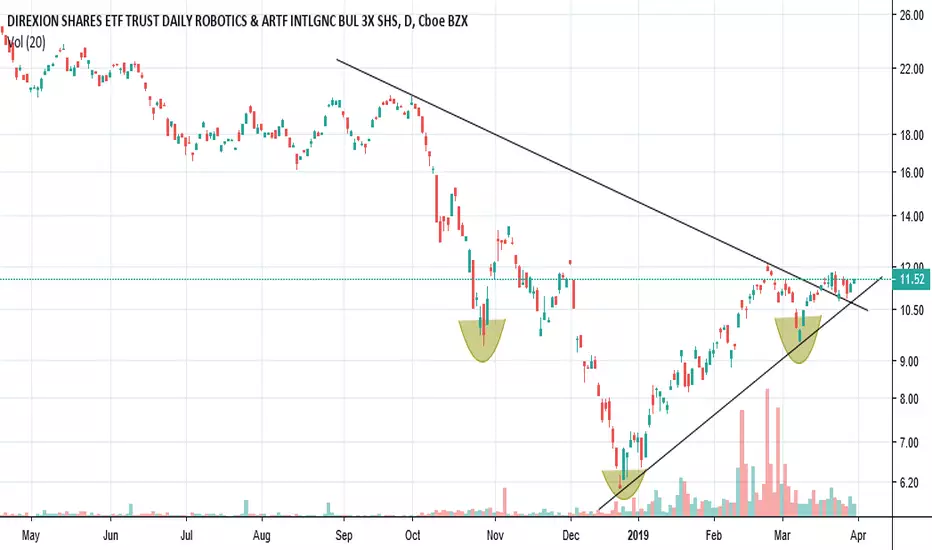
V BottomLEVERAGED Volatile!!! Not far from break out
Leverage can be dangerous especially if you hold on to it. This can move up and down $10 a day or more.
I see the strong support at 120ish. I would think a stop on this would be difficult. But we are all different
I am wondering if things get back


Man vs Machine www.chinadaily.com.cn
www.direxion.com
When viewing buying opportunity, I look at a few things, one of which is how much emphasis is the government paying attention to this sector and the grant/budget being allocated to it.
Next and more importantly, I study the chart and see if the price action

$UBOT There was that pullback, let's see if continues upward.Looks like it could run some more from here.
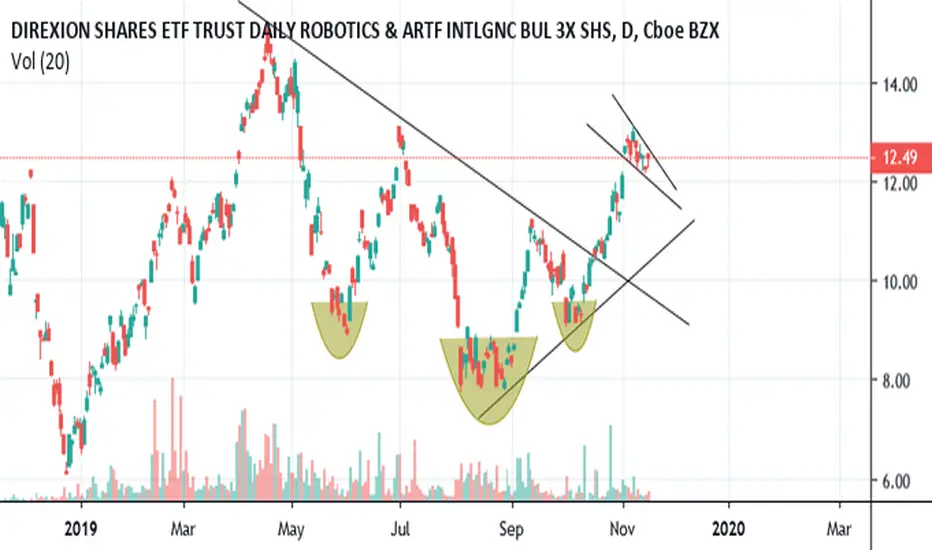
$UBOT Kept pushing up this week, could be a pullback here.Made a bit more upside movement this week, looks like it could pull back a bit this week.
Still good buy volume on it.
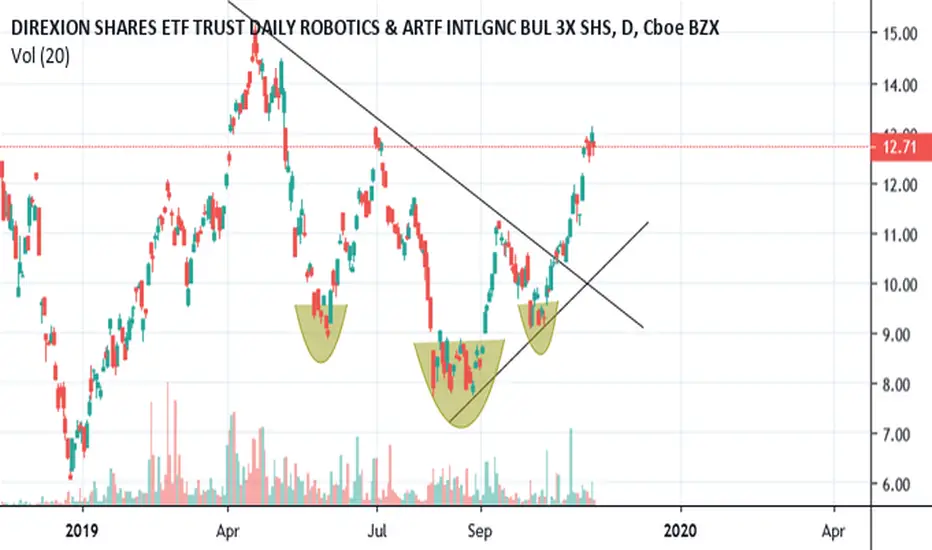
$UBOT Plenty of buy vol along with inverse H&S, and wedge break.Looks like plenty of buy volume to push this even further.

$UBOT Kudos to those that jumped in this one last week.Bounce off that IH&S from last week, let's see how much more momentum it has.

See all ideas
Summarizing what the indicators are suggesting.
Oscillators
Neutral
SellBuy
Strong sellStrong buy
Strong sellSellNeutralBuyStrong buy
Oscillators
Neutral
SellBuy
Strong sellStrong buy
Strong sellSellNeutralBuyStrong buy
Summary
Neutral
SellBuy
Strong sellStrong buy
Strong sellSellNeutralBuyStrong buy
Summary
Neutral
SellBuy
Strong sellStrong buy
Strong sellSellNeutralBuyStrong buy
Summary
Neutral
SellBuy
Strong sellStrong buy
Strong sellSellNeutralBuyStrong buy
Moving Averages
Neutral
SellBuy
Strong sellStrong buy
Strong sellSellNeutralBuyStrong buy
Moving Averages
Neutral
SellBuy
Strong sellStrong buy
Strong sellSellNeutralBuyStrong buy
Displays a symbol's price movements over previous years to identify recurring trends.
Frequently Asked Questions
An exchange-traded fund (ETF) is a collection of assets (stocks, bonds, commodities, etc.) that track an underlying index and can be bought on an exchange like individual stocks.
UBOT trades at 21.60 USD today, its price has risen 2.48% in the past 24 hours. Track more dynamics on UBOT price chart.
UBOT net asset value is 21.97 today — it's risen 7.16% over the past month. NAV represents the total value of the fund's assets less liabilities and serves as a gauge of the fund's performance.
UBOT assets under management is 31.19 M USD. AUM is an important metric as it reflects the fund's size and can serve as a gauge of how successful the fund is in attracting investors, which, in its turn, can influence decision-making.
UBOT price has risen by 7.87% over the last month, and its yearly performance shows a −8.24% decrease. See more dynamics on UBOT price chart.
NAV returns, another gauge of an ETF dynamics, showed a 38.69% increase in three-month performance and has decreased by −5.41% in a year.
NAV returns, another gauge of an ETF dynamics, showed a 38.69% increase in three-month performance and has decreased by −5.41% in a year.
UBOT fund flows account for −1.24 M USD (1 year). Many traders use this metric to get insight into investors' sentiment and evaluate whether it's time to buy or sell the fund.
Since ETFs work like an individual stock, they can be bought and sold on exchanges (e.g. NASDAQ, NYSE, EURONEXT). As it happens with stocks, you need to select a brokerage to access trading. Explore our list of available brokers to find the one to help execute your strategies. Don't forget to do your research before getting to trading. Explore ETFs metrics in our ETF screener to find a reliable opportunity.
UBOT invests in funds. See more details in our Analysis section.
UBOT expense ratio is 1.32%. It's an important metric for helping traders understand the fund's operating costs relative to assets and how expensive it would be to hold the fund.
Yes, UBOT is a leveraged ETF, meaning it uses borrowings or financial derivatives to magnify the performance of the underlying assets or index it follows.
In some ways, ETFs are safe investments, but in a broader sense, they're not safer than any other asset, so it's crucial to analyze a fund before investing. But if your research gives a vague answer, you can always refer to technical analysis.
Today, UBOT technical analysis shows the buy rating and its 1-week rating is buy. Since market conditions are prone to changes, it's worth looking a bit further into the future — according to the 1-month rating UBOT shows the sell signal. See more of UBOT technicals for a more comprehensive analysis.
Today, UBOT technical analysis shows the buy rating and its 1-week rating is buy. Since market conditions are prone to changes, it's worth looking a bit further into the future — according to the 1-month rating UBOT shows the sell signal. See more of UBOT technicals for a more comprehensive analysis.
Yes, UBOT pays dividends to its holders with the dividend yield of 1.18%.
UBOT trades at a premium (0.12%).
Premium/discount to NAV expresses the difference between the ETF’s price and its NAV value. A positive percentage indicates a premium, meaning the ETF trades at a higher price than the calculated NAV. Conversely, a negative percentage indicates a discount, suggesting the ETF trades at a lower price than NAV.
Premium/discount to NAV expresses the difference between the ETF’s price and its NAV value. A positive percentage indicates a premium, meaning the ETF trades at a higher price than the calculated NAV. Conversely, a negative percentage indicates a discount, suggesting the ETF trades at a lower price than NAV.
UBOT shares are issued by Rafferty Asset Management LLC
UBOT follows the Indxx Global Robotics & Artificial Intelligence Thematic Index. ETFs usually track some benchmark seeking to replicate its performance and guide asset selection and objectives.
The fund started trading on Apr 19, 2018.
The fund's management style is passive, meaning it's aiming to replicate the performance of the underlying index by holding assets in the same proportions as the index. The goal is to match the index's returns.