UNG - 30 minFolks, this short is NOT a CERTAINTY, but the R/R is there IF you use stops in the 6.69 / 6.82 region.
I've also labeled a possible Leading Diagonal in pink. IF price goes over 6.82 to new local highs, THEN probability shifts in favor of a more meaningful bottom, though not necessarily THE BOTTOM...
CAPITAL PRESERVATION is PARAMOUNT
UNG trade ideas

UNG - DailyUpdating the bigger picture. Presumed wave (iv) came right to the 38.2 retrace target (shown on smaller timeframes) and reversed. This rhymes with the pervious minute circle wave iv of a larger degree. However, note that this decline is nearing its long-term completion on positive divergence. Such divergence can persist thru wave (v) of v on new price lows.
Beginning of this decline in Aug/Sep '15 was difficult to count, and wave (ii) was a complex w-x-y-x-z. Larger-degree fibs are difficult to measure, and UNG's decay further complicates the measurements.
Bottom line: DO NOT risk too much here, and DO NOT overstay your welcome if you're still in this short. I anticipate the reversal could be sharp, once decline completes.

UNG - 15minI had wanted a bit higher into resistance to remove my long hedge and add to shorts, but if price breaks down thru signal levels indicated, then that brief touch of resistance this morning may be all she's got...

UNG - 30 minI'm already short, and plan on removing hedges on any retrace. The resistance box, as noted, is a candidate entry for new shorts, especially if a bounce into this resistance region is in 3-waves. Over 6.82, don't get caught holding short. Below 6.16, you've missed your chance at high-risk short entries, but the R/R may be in your favor for a late entry with better-defined stops.

UNG - 1hrUNG has turned down through micro support after completing a possible 3-wave move into resistance. As long as price stays below 6.82, and below the prior high, I'm expecting 5.23 or lower. Possibly much lower, but only a confirmed decline and its form will determine high-probability targets.

UNG - 15 minApproaching resistance where ST longs could take at least partial profits, or hedge if inclined. Additional notes on 1hr chart.

UNG - 1 hrHate to alter my bullish count, but if UNG gets over 6.82, followed by the 7.14/.18 area, then natural gas can be postured more bullishly than I allowed earlier. The bearish count is no where near dead, and remains my primary expectation, however those long in March have done quite well. MACD still retains negative divergence, and price may turn lower below the regions indicated. Don't hang around too long expecting higher, especially if support begins to break down. See 6.17/.20 region.


UNG - 15 minEntering a strong confluence of fib resistance matching Elliott Wave targets for wave (iv). At least a corrective reaction from the 6.70/.83 region is expected. This is a good place to take profits on any longs, or at least hedge them. I'm adding shorts looking for a new all-time low, but if a move down appears corrective into alt (ii) support, I'll take those shorts off early.

UNG - 1 hrApproaching inflection point on UNG near confluence of 1.00 fib extension of waves (i)-(ii) and 38.2 retrace measured from waves (ii)-(iii). Anticipating decline in wave (v), though corrective decline into alt wave (ii) - shown in blue - would suggest the possibility that a significant low was seen at 5.79.
Took profits on BOIL. Only remaining shares were bought very near the v of (iii) lows. I have some DGAZ purchased on 3/11. May add more today. So, I'm barely net long with 2x leverage, while hedged with 3x leverage. Will be net short if I add DGAZ.

UNG support on the RSI daily, plus divergence spottedI don't use divergence much but it's here for you to see. So there's positive divergence, but what's more important is that back in late 2015 the RSI daily down trend was broken. That spot where it was broken became support, so I drew a horizontal line at support. It's reaching this support line for the first time.

UNG - 15minPotential corrective paths to wave (iv) resistance shown. Positive divergence on MACD may continue to hold through wave (v) into the low 5s, also seen on longer timeframes. A 3-wave corrective bounce indicates wave (iv) even as high as the low UNG 7s.
A bullish potential will be depicted only if a 5-wave pattern develops, at which point a corrective retrace support region will be identified for potential long entries.

UNG - 1hrWave (iii) likely completed. Bounce off 161.8% region suggests resistance for wave (iv) could be visited this week. Over UNG 7.20 in an impulsive fashion suggests wave circle v is complete already at the recent low. However, base case is that resistance will turn price down to the low 5.00 region, with possible washout near 4.00. Wave (iv) is technically valid until the wave (i) low in mid-7s is taken out, although an impulsive structure forming lower would be a bullish indication.
Long positions are aggressive. Better to be cautious; wait for 5 waves up followed by a 3 wave correction. A bullish pattern would only be confirmed on taking out the presumed 5-wave high, should one occur. New shorts should wait for wave (iv) resistance.


ung in the channelyesterdays bounce was still in channel . still downward trend with no bullish indicators on 4h and 1d other than being oversold.

UNG - 2hrUNG has reached Fibonacci support in this decline, however wave iii could continue to extend as low as 5.61/5.22 before bouncing in a corrective fashion. IF the decline continues, resistance should be lower for wave iv and (iv) targets.
Positive divergence on MACD does NOT indicate imminent bounce in price under these circumstances, but a corrective bounce would not surprise.

UNG - DailyUNG has reached Fibonacci support for a 3rd wave, although the degree is unclear given the start of this decline. Near-term bounce may reach the high 6s, or perhaps as high as 7.67/8.75. Either way, a corrective 3-wave bounce into resistance sets up another decline, likely below 5.00 or even 4.00.
Positive divergence on MACD still holds, and may continue to hold through waves iv and v.


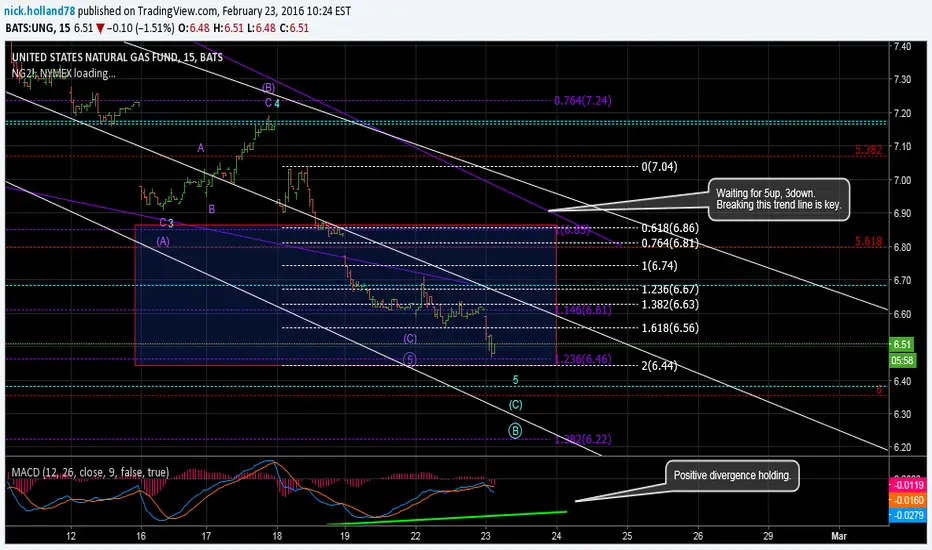
UNG - 2hr (revised)Bottom of my target box was tested today with 6.47 low. Should 6.47/.38 fail, then I'd expect 5.89 to be tested. Positive divergence still holding on MACD.
Original purple ED count was invalidated 2 days ago. I've revised it here in order to demonstrate that a rally should not necessarily be viewed as a long opportunity - not as a trading suggestion. Resistance at 7.24/.48.
Blue (cyan) triangle count adjusted primarily based on NG futures holding above December low. UNG decay has clearly broken below its 6.91 December low.
Initial indications of a potential bottom would come only with an impulsive 5-wave move higher - breaking above overhead resistance - followed by a 3-wave pullback holding above 50%-61.8% retrace support.

UNG - 15 minElliott Wave pattern nearing completion. Should 6.44 fail, then expecting test of 5.89 region below. Positive divergence still holding on MACD.
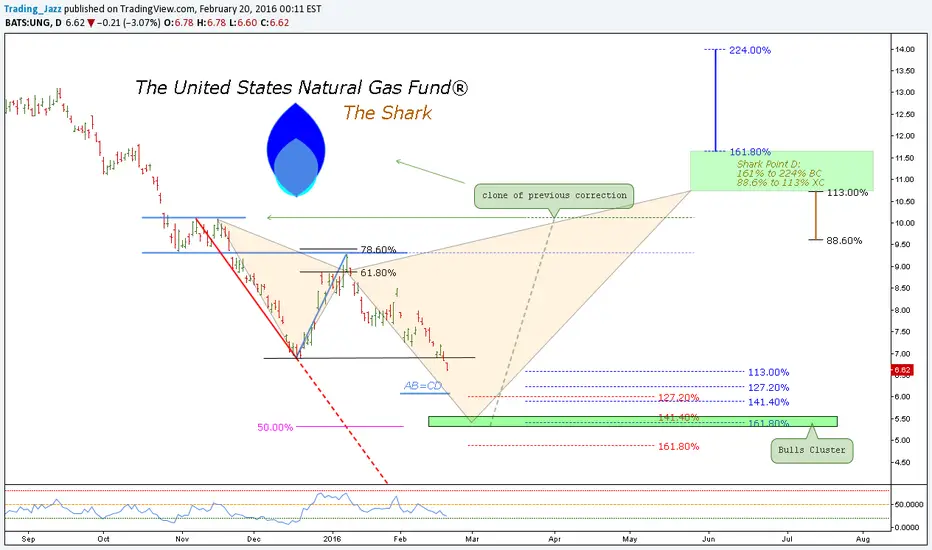
(Daily) US Natural Gas // The Shark // IF=THEN ®AMEX:UNG
Are the bulls tired of waiting...? $5.50 as ignition...
SHARK:
Point B:
61.8% XA
Point C:
113% to 161% AB
Point D:
161% to 224% BC
88.6% to 113% XC
Target:
38.2% to 100% CD
Safe Trades;
open.spotify.com
UNG - 1hrDetail on minor waves and Fibonacci relationships discussed on related daily analysis.
I'm holding a speculative long position which will be dropped on a break below the blue box.

UNG - DailyUNG posted new lows for the week. Positive divergence on MACD is still holding.
Bullish alternative:
Lower trend line of presumed ending diagonal was exceeded. Possible today's fall was an overshoot. Probability this will be a lasting low in natural gas can only be confirmed by an impulsive rally with 5 waves up, and 3 back down holding the coming low.
Bearish alternatives:
The cyan (blue) triangle remains valid, especially considering February's low is holding over the NG continuous contract low from December. Bounce should not exceed 9.27 in this count. A corrective rally over 9.27 would indicate the yellow alternative with another lower low to follow into the Spring.
