UNG - 2h Potential BottomToday's price action achieved the minimum target for an ending diagonal into support. A potential bottom, possibly a significant long-term low. Bearish alternatives include a potential larger triangle. Also, possible the Elliott Wave degree count is off by one, which resolves into another lower low indicated in yellow. Re; yellow alt, reference daily UNG analysis to see how initial impulsive Minute and Minuette counts were subjective.
UNG trade ideas


UNG - DailyBear market in Natural Gas nearing resolution. Elliott Wave counts approaching completion. Impulsive rally thru UNG 13.10 suggests significant low already in place.
Note positive divergence forming on MACD (as well as other indicators not shown).

UNG - 2hPreparing for a long position in Natural Gas on what appears to be the nearing completion of a major correction. Elliot Wave count shown may resolve on one more low. Note positive divergence in MACD.

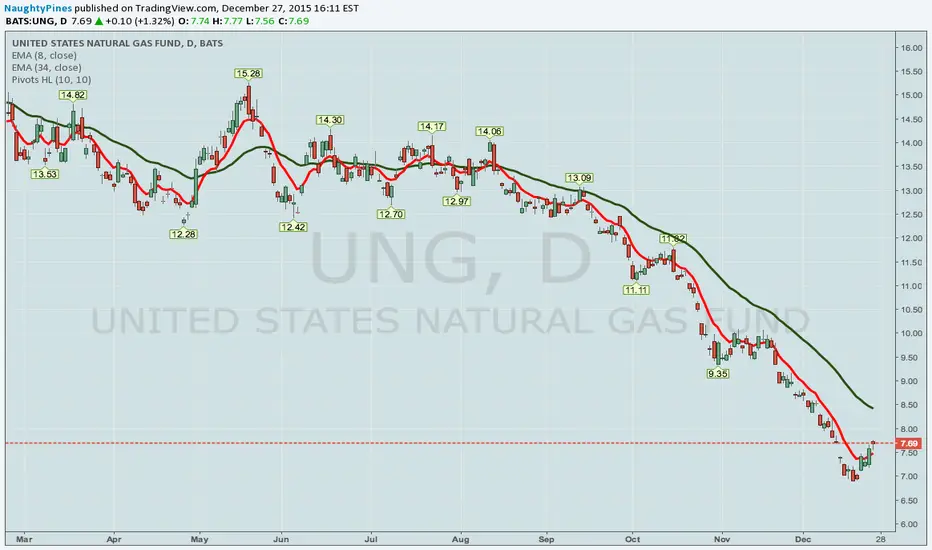
UNG -- COVERED CALL IDEATruth be told, I was burned somewhat by UNG this year, as I was expecting a seasonality bounce which has not come due to mild temperatures associated with El Nino. Moreover, in 20-20 hindsight, a debit spread was probably not the way to go due to inflexibility of the setup if you are just totally directionally wrong or if your timing as to the directionality is off.
In any event, and although volatility in the underlying has diminished somewhat since the making of a significant low around 7.00, there remains sufficient volatility in UNG to go covered call here.
The setup:
100 Shares UNG at 7.69
1 Feb 19 8 Short Call
Entire Package: 6.91 debit (meaning your break even for the setup is $6.91/share, excluding fees commissions)
Max Profit: $109 (if called away at $8)
Tips: Look to take off the entire setup in profit before expiry if profit approaches what you would get if called away. Roll out the short call to a later expiry if it is nearing worthless; look to roll to a strike that at least exceeds your cost basis in the underlying.

Swing trade on UNGA potential swing trade on UNG off a downtrend breakout from Sept 2015.
Target price: 10.15
Buy opportunity: zone between 8.85 and 9.05

OPTIONS TIP -- ROLL YOUR COVERED CALL SHORT UP, EVEN IF ITMI recently set up a covered call in UNG, with the short call strike at 8.00 (Feb 19 expiry). Price has hurriedly broken my short call strike and is "in the money." What do I do now?
One option is to do absolutely nothing. After all, my expectation when I put on the setup was to get called away at 8.00 at expiry or take the whole setup off in profit prior to that, so all is fine and dandy from that perspective.
Nevertheless, I am not one to pass by potential, additional opportunities in a setup that has gone better than planned, so one thing I should at least look at is whether I can roll the short call up to a higher strike for an additional credit such that my "call away" price is better and my cost basis in my underlying is reduced even further. Depending on how I feel about the trade and whether I can get a credit for the roll, I can either roll to a higher, in the money strike, or to one that is out of the money (with the important point being getting an additional credit; if you can't do that, don't roll).
In this particular case, there's not much I can do that's sensible at this moment in time. The only expiration in which I can both improve the short call strike (to 9) and receive a credit for it (an additional .40) is the Jan 2017 expiry, so I'm going to watch and wait on a potential roll more toward expiry, at which time some weeklies might become available that would have half strikes to use (e.g., 8.5). After all, getting called away at 8.5 beats getting called away at 8.00 ... .

OPTIONS TIP: COVERED CALL CANDIDATE TRADE SELECTIONRecently, I've posted a number of ideas of covered call setups, but which one or ones do I choose? I can naturally try to put all of them on, but for various reasons I may not want to do that ... . So how do I cull out the wheat from the chaff? The UNG, GPRO, HUN, MW, and JCP ideas are the result of quite a bit of work already; out of these, are some better than the others?
Naturally, the selection choice is somewhat subjective, but I do think a couple of these have slightly more going for them than others.
Were I to be stranded on a dessert island and could only take 1 or 2 covered calls to the island with me, I'd probably go for UNG and JCP. Why? They are the most liquid underlyings of the bunch, which at least partially insures a fairer price for my setup than the other plays; bid/ask spreads are wider in the others, which potentially makes getting fills at the mid price more of a headache. UNG and JCP also offer weeklies, which offer a little bit of more flexibility in terms of rolling my short call (although this is not the kind of deal breaker it is when I'm doing short strangles, where I really want to have those weeklies to do short-term rolls with if I need to).
Were I to have to rank the plays, it would be a close call between GPRO and HUN, after the UNG and JCP plays.
GPRO's not as liquid as UNG and JCP; then again, its liquidity isn't terrible, it offers weeklies, and has quite a bit of volatility in it such that the premium received for the short call is fairly rich (in fact, its IV is higher than in UNG, JCP, or HUN), but a potential downside is that I'd have to devote about $1700 in buying power to the trade (100 GPRO at 18.22; Feb 19th 19 short call) and that might of concern to smaller account holders.
HUN has better liquidity than GPRO, but no weeklies, but it's also cheaper than GPRO, so ties up less buying power.
MW is the least liquid of the bunch and has no monthlies ... .
The other factor that you might want to look at is correlation. For example, I've already got a long natural gas play on via CHK. Do I really want to increase my exposure to natural gas?
All of these factors -- liquidity, availability of weeklies, current implied volatiity, correlation, buying power -- should be evaluated in considering which plays to go with ... .
Developing Falling Wedge. Sharp rebound is around the corner$UGAZ, $DGAZ, $SPY, $OIL, $USO, $BNO, etc


Natural gas or oil provides more return in this recovery?One of the great feature I like with TradingView is the ability to compare different ticker via arithmetic addition/division/subtraction.
From here, I'm comparing between UNG and USO. Since both are directly related to energy, tough choice huh?
Charting it out helps a lot and we can see a clear breakout trend between the ratios!
Clearly Natural Gas (UNG) might possibility provide the best return for your money on energy as compared to Oil (USO) over the long run.
------------------------------------------
** Note: USO have been severely under performing since 2008 after the recovery of oil price due to the price difference between each month's oil futures contract. It will not be a clear reflection of the actual market.
This is only if you're considering between USO or UNG. Try it out by charting other ETF/ETNs/stocks by yourself!

UNG (NATURAL GAS ETF) LONG IDEAHi!
I think natural gas is going to make a good move in the nearest time.
As we can see gas was in the range for some time with the following support line breakthrough. However, the breakthrough was made on a low volume and it was a fake move. Just in couple of days was another breakthrough. Gas has made an opportunity to break the resistance line on a high volume. So, now we see our etf at previous support line.
Thus, a pullback has already happened and there are good chances that we'll see a new bullish wave. In this case I would recommend to open a long positiong at 21.81 with targets at 23.85 and 26.4 (basically, I don't set my profit targets when I open a new position. I look at volume and price action to make a decision concesrning when I shoud close the position). However, if the price will go below it's support line we can just close our long position or we can immediately reverse our current position and open a short. It can be a pretty good bearish wave then.

$UNG $NGAS Its that timeSeasonal Play ..o durr, right ? it gets cold people need cheap heating with Natgas at 3.65 its a bargain right now. IMO , I almost feel like todays 19.10 and lower was the perfect entry and I chickened out,
options are cheap right now,
Nov 14 22.00 calls are trading at .16 just yesterday they were at .21 so $5 cheaper,
DEC 14 25 calls are trading at .24 slightly higher than yesterday go figure
How ever looking at this chart i set up there the trend channel that i set up with a few touches, but at the beginning of Nov 2013 there a clear signal IMHO !!
HAPPY Trading hoping to make these my last few trades of 2014,
The SPY and DIA are so unclear right now

UNG @ a short term resistance levelBased on past Fibonacci retracements, UNG has to surpass resistance at 21.65 region


The Price is Right for Natural GasFor detailed analysis, please see our blog post published on 8/10/14 and feel free to post a comment there: www.syncubate.com
As can be seen from the daily chart, UNG has fallen from just over $26 a share near the end of June to just under $22 a share at the close of trading on Friday. From the high point of this trending move lower, UNG has had a nearly 20% drop in price.
The ADX line has since topped out and is dropping on the daily time frame, indicating that the trending move lower may have abated for the time being. This is further confirmed by the recent spike of +DMI above -DMI, as the bulls begin to stand their ground.
The MACD has also crossed above the signal line, which is another sign that a push higher in price by the bulls may be impending at this point.

UNG - Bullish Case for the Energy SectorUNG has been consolidating for a few weeks long, which is normal after an explosive move to the upside. He have made higher highs and as long as we stay above 24.29, we stay bullish. A bullish move in Natural gas will be positive for oil and gas companies, especially the ones that are more gas focused. Today was a good entry for UNG. there is also a double bottom on the weekly chart for UNG and hence my bullish thesis. Unfortunately there is not enough data to see how UNG reacted to Double bottoms. But this is the lowest low UNG has seen and im Bullish on this commodity.

Natural Gas Futures Roll And Weekly Reports Be Careful Of ContanI did this for my own reference.
The monthly rolls are approximate, do you own due diligence.
The weekly supply data comes out on thursdays at 9:30 EST
Trading View allows you to scroll into the future and project future events. Scottrade Elite does not.
Sierra Charts for a futures account allows you to do the same and has a very solid and easy to use platform.
When trading UNG, be aware of contango when the contract rolls into the next month. The current month NG contract can be at 4.422 and the next month at 4.622 and when rollover occurs the UNG price will be the same. Always be monitoring the current and next months contract spread because that is what you are giving away at rollover.
Read up on contango if you are trading UNG.

UNGUNG correlated to Natural Gas futures bearish move this morning has taken away gains from February 20th.
The sudden reversal will continue to play out providing an excellent opportunity to make an options play on this one. A simple Buy on the Put at $27 Strike at the opening bell would have up by +.66%. Target underlying price is $24.92.
The Historical Volatility is at 98% and the Current Implied Volatility is at 57%. Implied Volatility ranking is 51.60%. Under the rules of engagement with these volatility percentages, it is a "sell" signal going into the last "leg" of the March 14 (25) option chain. The Delta at $27 Strike is -.561.
HV being near 100% means there is high volatility giving us a directional move thus the underlying volatility will offset the time decay on the option premium.
UNG is currently down -5.60%.
I BOT a PUT at $27 Strike, 1.40 premium and one more PUT contract at $26, 1.17 premium. The $27 Strike chart shows a resistance at 1.88; but a "sweet spot" to come, looking at 2.72 to take profit before March expiration.

Very BULLISH on WEEKLY chartThe price just went above the Fib level, lets go for the next level around 31$

UNG needs a little higher before likely turning back downThis is a dual forecast. Looking at UNG from an elliott wave perspective, it is carving out a 3-wave corrective pattern higher. This lends a high probability that multi-year lows are not yet in. As a reminder, a five wave pattern is needed to signify a new bull trend. I can find no way to count five waves since the 2012 low.
To summarize, longer term (weeks to months), UNG should head back to the lows.
Near term (days to weeks), however, the C wave in progress is not yet complete until it completes 5 waves on the daily time frame. Right now it appears to be completing a wave 3 of C. The fibonacci projection of 26.43 is a high probability target where this corrective leg higher is proportional to the 2012-2013 rise.

Flat Base Breakout Trade Setup - EducationalFull Credit goes to Jake Bernstein. Jake is a Legendary Futures Trader who has done extensive historical back-testing. He's a best-selling author and Jake has published many of his best trade setups.
One of Jakes' most profitable setups is what he refers to as a "Flat Based Breakout".
Setup Specifics:
1. Typically find on a Daily or Weekly Chart.
2. Ideally You want to see a significant fall in price of the security your looking at.
3. The Longer price stays in the consolidation phase the better. This creates more buyers and sellers and/or shares traded in this area so when "The Break" occurs the traders who were "Short" have to cover creating a quick and significant move.
This is a Daily Chart of UNG (Note: Better Examples Below) which as you can see has fallen from 87.50 in 2010 to a Low of 14.25 in 2012. UNG has been in a Trading Range from 24.60 to roughly 16.60 for over a year now. This has created a lot of "Energy" that could create a significant move when the High of 24.09 is taken out.
On this chart I placed 3 Fib Retracements at major Swing Highs to the low of 14.25 (You can tell where I drew the Fibs from the top of the White Dashed Lines.
For Fib Values I use
0
.383
.50
.618
.786
1.0
1.272 (Extension)
1.618 (Extension)
To clean up the chart I took off all the lines that weren't in a "Confluence Area" of multiple Fib Levels. I find these "Confluence" areas are great Price Attractors. When price breaks above 24.09 the first 3 targets are shown by the White Ovals on the chart. Rough prices are Target 1 = 36.00, Target 2 = 42.50, Target 3 = 50.00 area.
I ran across this chart and wanted to Share the Setup so you can keep a lookout for it. After taking a look at a few charts others have shared on TradingView I quickly found several that I thought were better examples than UNG, However, this specific Trade Setup wasn't referenced.
Timwest Posted a Great chart of TSLA.
Look at the bottom left of the chart. Notice Consolidation area, then a Gap above, Test, then she stock took off.
JR Posted a Great example of symbol NBG
Notice the price action when you press the "Play" icon to fill in the last 2 months.
Can anyone find any current examples?
