Sibanye Stillwater and Palladium buy entriesPalladium and SBSW are approaching demand areas and we can expect a reversal to the upside with SBSW offering 4X trade from 5 to 20. And similar with PALL. NATGAS are also approaching demand but no confirmation is seen yet.
#stockstobuy #stockstobuynow #palladium #forextrading #natgas
UNG trade ideas

THREE WORDS THAT YOU SHOULD KNOW. NATTY GOES CRAZYNatty is a slang term for 'natural gas' or natural gas futures. Natural gas is among the most-volatile commodities, especially in contracts for prompt delivery.
A big reason why is the demand for natural gas varies considerably based on the weather as it's primarily a heating fuel; though it's increasingly used in electricity production and that can also make it subject to swings on hot summer weather due to air conditioning demand. Increasingly, LNG demand also dictates the price of natural gas.
Forecasters from Atmospheric G2 said last Thursday that above-average temperatures are expected for the eastern two-thirds of the U.S. from Feb. 6 to 10.
Natural gas prices are also under pressure after the Freeport LNG natural gas export terminal in Texas announced in January, 2024 that it would close one of its three production units for a month for repairs after extreme cold in Texas damaged equipment. The closure of one of the power units will limit the export of natural gas from the United States and increase its supply.
Front NYMEX:NGH2024 Natural Gas futures contract recently fell to all-time low, below $1.900 mark.
An unusually mild winter reduced demand for natural gas and kept U.S. inventories high.
Forecasters at Maxar Technologies said last Wednesday that weather is forecast to become warmer over the next two weeks from the Rockies to the Midwest.
According to BNEF, Lower 48 States Dry Natural Gas production on Wednesday amounted to 104.2 bcf per day (+4.2% y/y). Demand for Lower 48 States Dry Natural Gas was 93.1 bcfas of Wednesday, according to BNEF. (+8.9% y/y), and net LNG flows to US LNG export terminals declined to 13.5 bcf as of Wednesday. (-4.2% by weight).
Reduced U.S. electricity production will negatively impact demand for natural gas from utility
providers.
The Edison Electrical Institute reported Wednesday that total U.S. electricity production fell -8.1% year-over-year for the week ending Feb. 3, and total electricity production in the US for the 52-week period ending February 3 fell by -0.4%.
The US Climate Prediction Center said there is a more than 55% chance that current El Niño weather conditions will remain strong in the Northern Hemisphere through March, keeping temperatures above average and putting pressure on natural gas prices.
AccuWeather predicts also El Niño will limit snowfall in Canada this season and also cause above-normal temperatures in North America.
Gas storage facilities in Europe were 71% full as of January 29, above the five-year seasonal average of 58 percent for this time of year.
Baker Hughes reported a week ago on Friday that the number of active U.S. natural gas drilling rigs fell by -1 rig to 119 rigs for the week ended Jan. 26, just above the two-year low of 113 rigs recorded on Sept. 8.
Rising to a 4.5-year high of 166 rigs in September 2022 from the pandemic-era low of 68 rigs recorded in July 2020 (data dating back to 1987), rigs number decreases again, since Q4'22.
Recent EIA report showed in full accordance with expectations, a decrease in reserves of -75 bcf that is much less than the 5-year average for this time of year of -193 bcf.
The main technical chart is for United States Natural Gas Fund LP AMEX:UNG ETF that offers straightforward exposure to front-month natural gas futures
Basically this graph clear illustrates that disinflation era is still exists, as bearish sentiment is still prevails in the market since the Q4'022, after a key 5yrs SMA breakthrough.
Perhaps this is the end, and market capitulation is almost right there, as it typically happens each time in long-term downward market trends.

Natural Gas Capitulation...incoming!Nat gas gapped down yet again.
This is commodity is basically falling off a cliff as if society no longer needs it.
We are reaching historical price levels that make this an absolute juicy long term investment.
A measured move to the downside was completed today.

UNG ( Natural Gase Futures ETF) Swing trade Short then LONGUNG is shown here on the 15 minute chart with text box comments showing the three trades
over 8-9 trading days yielding 25% overall first two trades short then a one day long trade at
what may be an early reversal. A pair of hull moving averages 49/140 ( multiples of 7) are used
to generate buy and sell signals in golden and death cross fashion. A dual TF RSI indicator is
used to support those signals. As swing trades with typical stop losses these were quite
profitable with low risk. As an alternative if a trader has options charting available the same
strategy/ method can be applied for significantly higher profit with less capital in each trade.

UNG rising in the cold of winterAS shown on a 4H chart, UNG which tracks natural gas futures has been rising now for three
weeks with the typical demand of the winter months and the cold weather impacting new
supplies while Russia's war continues. Volumes are relatively high while dual TF ( 4H and
1Week) crossed the 50 line on December 28. Price has now crossed over the Fib -.5 line
of the downtrend from October and has that line and the anchored intermediate term
VWAP for support and the setting of a stop loss ( strength in confluence)
I see this as a setup for a long swing trade of UNG or BOIL or XNGUSD on forex or any of the gas
companies ( LNG) to trade commodities while the equity markets get sorted out.

UNG - 1W - Deviation for higher Hi guys,
Natural gas could be warming up for a run. Huge volumes. previous range broke down but the price is quickly recovering with div. I would recommend to wait and check the reaction approaching the previous range. If the price can go back inside, next stop is the top of the range. This could lead to further upside.
If the price is rejected, more down to come :)
Hope you appreciate. Dont hesitate to like if you share
NFA
Remember, this is on a weelky timeframe

UNG - Crazy Buying Opportunity! Honestly, for the past 15 years this Stock has been suffering and I think it has already reach the bottom of this fall.
With the following factors (Wars are taken place, Winter is coming, and Natural Gas is something we need on a daily basis), I believe that putting some cash into the following Stock would be one of those crazy opportunities which may buy and forget about.
Please note to make sure that you dont go all in of course and to prep for second buying opportunities.
Remember to reach out if you make banks ;).
#Poor #Aiming_to_get_richer

UNGHi my friend i offer you next setup for UNG i mean it go up. Hear will be rotation and go up. Nice support with best ratio :)

UNG ACCUMULATION?Seems to be a Darvas box being formed. With wars being fought overseas it's very possible commodities could begin a bull run. This is a good range to slowly accumulate as macro plays out.

Nat Gas (UNG, NG) Retracement LongConsidering a trend continuation long in NG here. Per the attached charts (also using futures for zoning), we've had a decent pullback and are nearing intermediate-term (daily) demand. Using the futures chart, there are multiple 15-minute demand zones stacked 3.058-3.006. So, if we penetrate that zone (flirting with it now), look for micro timeframe reversal cues. Looking for a solid swing from this one, so we'll see what happens! Quick take, but want to get this posted as the trade is setting up as I type.
Godspeed!
Jon @ LionHart Trading

UNG longAMEX:UNG 's hourly chart shows both a double top and a double bottom pattern. Neither of them has reached their price target, yet. There's also both a rising (intermediate term) and a falling (short-term) trend channel visible.
On the face of it, the bearish patterns seem to have a bit more credibility: Double tops have a higher win rate and a higher profit factor than double bottoms, though both are very profitable. And the down trend is the more established of the two trends.
That said, the more recent signs point to strength. The EIA has just published weekly storage numbers, which proved to be higher (more bearish) than anticipated. In my experience, natural gas fundamentals are often confounding, and when there's a logical tension between a fundamental signal (bearish, in this case) and the reaction to it (price is up since the EIA announcement), I trust the reaction more than the signal.
So, long UNG calls. My first target is $7 (or $6.99), as the chart suggests.

UNG Setting Up For A BounceThis Is What Accumulation Looks Like. UNG Is Likely Setting Up For A Move Up Soon. The Price Action On The Weekly Is Showing Accumulation. Volume Is A Secondary Consideration To Price Action, But It Helps To Confirm Our Thesis.

UNG short term bull trend reversal.Got into this trade yesterday, but wanted to share. Starting on Sept 6/7th TPO graph was spending more time moving higher, PoC reflects that & a TON of SP's on the downside.
Consolidated yesterday just under lower band of vwap (quarterly) & with today's move it is now sitting just above vwap (q) and seems to be using it as support. Will monitor to close.
Using 20/50/100/200ema as support now with today's move. Last time I got caught holding 40% of my shares when UNG hit $8. Be careful with that level, monitor.
As usual chart times frames are from daily down to 5ming. I mainly use 15min-1hr.
Vwap I tend to use quarterly but also vary time frames for confirmations and/or trend reversals.
Thanks & happy trading!

UNG Testing Complex Inverted H&S NecklineUnited States Natural Gas Fund(UNG) is testing the neckline of a complex inverted head and shoulders pattern with an open and close above the neckline on a gap up in price today.
Based on the orange line measurement taken from the lowest point of the head to the neckline we get $1.89 which can be applied to the opening price today above the neckline and gives an upper price target of $9.92 to watch for which is in the same area as the red horizonal resistance level stemming from the early march spike up to and rejection from $10.
Inverted complex H&S patterns have a 71% success rate which means we multiply $1.89 by .71 to give us an initial upper price target of $9.33. Assuming that we have a successful breakout of the neckline to confirm the inverted H&S pattern profit-taking should be begin at the $9.33 level and peak in the $9.92-$10 range for short-term traders. Personally, I tend to just raise my stop-loss level as price moves higher rather than selling at the upper targets in case price continues to move above the projected targets. This gives me wiggle room for price to fluctuate at resistance/target levels while also ensuring that the trade is profitable should price reverse and I get stopped out.
The lower PPO indicator shows the green line rising after crossing back above the purple signal line which indicates short-term bullish momentum. Both lines trending above the 0 level indicates intermediate to long-term bullish momentum.
The lower TDI indicator shows the green RSI line rising above the 60 level which indicates short-term bullish price trend. The green RSI line is also trending outside of the upper white Bollinger Band which indicates extreme bullish price trend; generally you want to remain long when the RSI is trading outside of the upper BBand. Price tends to correct to the downside when the RSI line falls back below the upper Band so keep an eye on that when it happens if you are are short-term trader. Overall, when the RSI is trending between the 40-80 levels as it has been sine mid-June the the intermediate to long-term price trend is considered bullish.
Overall, UNG is looking strong with bullish trend and momentum indicators as the price of Natural Gas moves higher along with crude oil.
My buy price was $6.93 putting me up about +15% on the trade so far. Stop-loss is still sitting at $6.54 which is where I set it the day I bought, likely will move it somewhere around $7.50 tomorrow to keep me in profit should price reject at the neckline. Should price continue seeing strength this week the stop-loss will be moved closer to $8, just below the neckline.
Info on complex head and shoulders bottom patterns: www.thepatternsite.com

$UNG $BOIL $NG! - Natural Gas Game PlanThis has been pretty crowded with people trying to sink their life savings into the bottom here. No clear picture how long we are going to range here in the accumulation zone. Small positions spot trades can be added when we hit the bottom channel, but the real play will be when it gets above this zone. That would be the time go all in for a long term CALL

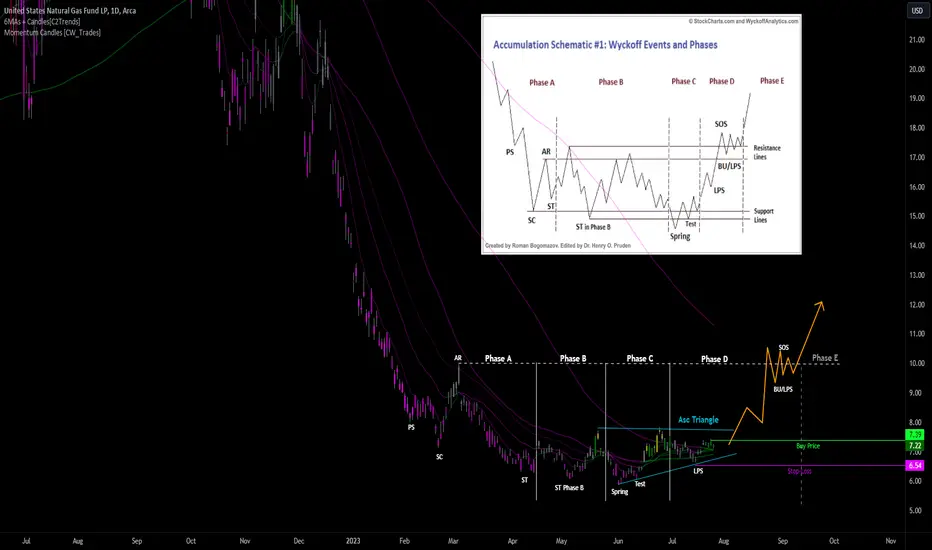
UNG Wyckoff Accumulation PatternUnited States Natural Gas Fund appears to be in the process of heading into the Back Up(BU) phase of a Wyckoff Accumulation pattern after levelling off in the $7 area after seeing a ~75% decline from the August '22 high near $35. There is also an ascending triangle pattern forming in phases C and D which tend to result in higher prices as UNG puts in a series of higher lows. What we want to see as a sign of strength going forward is for price to move above the upper blue line of the triangle pattern and follow the trajectory of the orange arrow which represents the anticipated path for price.
I've been in UNG since 7/20 with a buy price of $7.36. Current stop-loss order is at $6.61. No upper price target for now, just watching and waiting to see if price can break above the short-term resistance level at the upper triangle line near $7.85.
Possible Floor Market in GasStrong Accumulation in Gas Market.
Gas price shall be increase middle term.
Gas is a intermediate step between fossil combustibles and hydrogen.
Many countries have gas as main energy source.

Using volatility for income trades - UNG 59% ivNatural Gas and other commodities offer alternatives to main show which is the stock market indices. The spx sp500 is currently offering very low volatility premiums because its been trending higher in smooth way, and put sellers have crushed premium there.
UNG etf offers an alternative potential opportunity for me since premium is high enough and its already had a nasty sell off for months since fall of 2022. With headlines of hot summers and potential higher energy use, Im comfortable nibbling at premium trades in UNG.

Natural Gas Price Level Trend Support & Resistance Guide- Natural Gas Weekly uptrend confirmed for the very first time since Aug 2022
- also confirmed a daily uptrend
- Structure of the chart is looking better for the bulls compare to the last couple months.

UNG - Done with the bear?180 days under the 80 day MA. Over 2:1 containment ratio. Also nearly zero slope on the MA. There next week at latest. Ready for an upside explosion? My OTM calls are on deck!

UNG continues to rise UNG the ETF that tracks natural gas futures has continued on a significant uptrend since June
1st The 2H chart suggests to be that the trend will continue this upcoming week. UNG is now
above the POC line of the long multi-session volume profile. UNG has had support from the
VWAP line representing two standard deviations below the mean. In recent days, price has
crossed that mean VWAP in a sign of bullish momentum. The volatility oscillator indicator
is showing bullish volatility while the RSI is high above 80 and staying there without any fade
to suggest bearish divergence. Overall, I will continue to run my position without any partial
take profit. My target is the VWAP line that is two standard deviations above the mean
anchored VWAP and so presently about 7.85. Any new trade would have the same target
while setting the stop loss just below the POC line.

UNG Natural Gas ( Unleveraged) ETF LongOn the 4 hour chart- UNG had a head and shoulder pattern in May from which it descended
in a gradual fashion from May 25 to June 2nd and then reversed upward. The reversal occurred
at two standard deviations below the mean anchored VWAP and so deep in the oversold
area. Price has crossed over the higher VWAP line and so is in the band between the mean VWAP
and one standard deviation below it. Volumes have been persistent. Importantly, the zero
lag MACD shows the lines in parallel and crossing the zero horizontal line from underneath.
I see UNG properly set up for a long trade. Fundamentally, the hot summer may bring
increased natural gas consumption to make electricity for air conditioning. The dam disaster
in Ukraine may close down the biggest nuclear plant in Europe because of cooling
lakes potentially compromised. Natural gas may be an alternative fuel to make electricity.
Compressed NG from the US may become more important to Europe, especially since the
Nordic Stream pipeline issue developed. All in all, I think natural gas prices are likely to rise.

UNG - a composite operators dreamVolumetric accumulation on UNG, strong bullish bias on energy sector and notable accumulation on natural gas occurring on similar timeframes. Bullish divergence on multiple oscillators. Price has migrated and stabilized past the long term down-trend. This could be a sleeper for awhile, but primary harmonic profit target is around 17 bucks; the mid-point of the butterfly pattern.
