Tari CondorHi guys,
this is the best of the week!
2weeks, 8% strikes, implied volatilty is very high, IV rank>75, so this is a perfect scenario to trade this iron condor, because our odds match high IV. This means I feel confy highering a bit the size of the opration, usually my risk is 2-3%, this time I can risk a little bit more.
Enjoy your wallet!
Tari.
UNG trade ideas

Breakout in Natural Gas - UNGI've been following a declining wedge in UNG for sometime and we just had a breakout! I really like this sign (so far) as its also coincided with a lower support limit so we might be able to ride this for some time!!

Well, that was all I needed!I was expecting an uptick but not quite to the degree that we saw yesterday, it was very impressive. I'm expecting a march towards the overhead resistance's shown in the near term. Long-term I'm still bullish on natural gas.

New Upleg for Natty Gas?We had our first green candle in a while after I called an intermediate top after the breakout a couple of weeks ago. We are still in a strong uptrend and the turn yesterday (despite opening down over 2% at the open) is a bullish sign. Today I am looking for a confirmation signal or one in the coming days.


Natural Gas Downtrend ContinuesI still love it. Seriously. But I have to wait and you can see why - the stochastic indicators have only turned up on the daily time frame and we are now caught in this downtrend channel. I've show the lower limit which will hopefully hold, but I would be reluctant taking bearish bets on natural gas from here on in.


UNG - Got Gas?
This two year chat shows a 77% drop in Nat Gas from the high to the bottom - looks like the worst is over.
Use the red line as an ambitious target which the 2 year average price.
If you discount 25% for the 2020 Experience still looks like there is some up side - $17 - $18

Yeah, its an unfortunate confluence nowAn overhead resistance and a tweaked channel have colluded to make a an area that looks like a strong short for natural gas. The bars have changed colour and I think it could be a nice short play. I have not year decided how far this will go, please remember I have previously stated we are possibly in a bear flag. Also, don't misunderstand - I am bullish on natural gas long term, but since its breakout from its huge decline it could be time for a breather!

Natural Gas: Possible baby-bull flag inside a larger bear flagI'm very bullish on Natural Gas over the long-term. We have had a confirmed breakout bullishly from a descending triangle going back years, but now that we have had our early nascent move it might be time to pull back a bit. Of course all is invalidated if it breaks through the overhead support, but for now I'm seeing a small move up with a subsequent larger move down.


The Natural Gas Bull Market May Have BegunUNG had a spectatcular move the other day (once again I was on the wrong side of the trade but I the ship has been corrected). Rather than buying shorts after a rise in UNG, it appears like a bull market is starting so dips must be bought. The massive descending triangle going back to 2017 seems to have been broken with an open and close on the daily charts. Worringly though there appears to be a small bear flag on this breakout, so don't get disheartened. So long as we stay above the maroon line we should be all right.

UNG may have bottomed...From the chart we see a near perfect hit of a 1.27 extension of an impulse wave in the 11.5 region which may have marked a bottom in Natural gas, I say this because in recent weeks we are not seeing a pattern of lower highs and lower lows take hold. Furthermore there has been aggressive buying in related stocks such as SWN and RRC which may be an early indication of a change in the market trend. Using a Fibonacci trend based timing tool (horizontally w/ regard ot time as opposed to vertically for price) we see had relevance in predicting price reversals (from the 1 marked with a long vertical line in the graph) we are coming up on the 1.27 this Monday, it will be very interesting to see how the next few weeks play out.


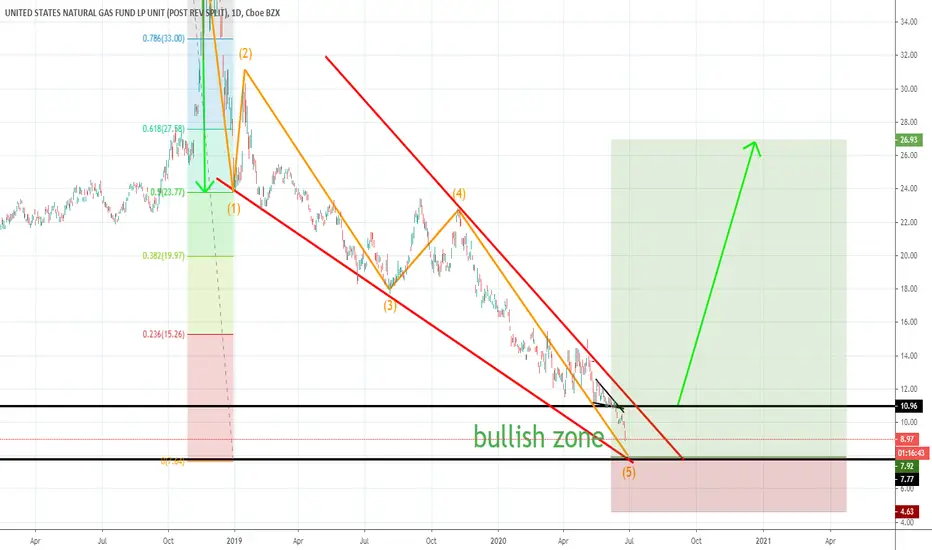

UNG american gas stock company in wedge once finishing 5 corrective wave down we go bullish long term and keep positions in bullish demand zone


UNG: ready to CALLI bought CALL on Friday market close,
Plan to hold it for two weeks, see what will happen in Jun


