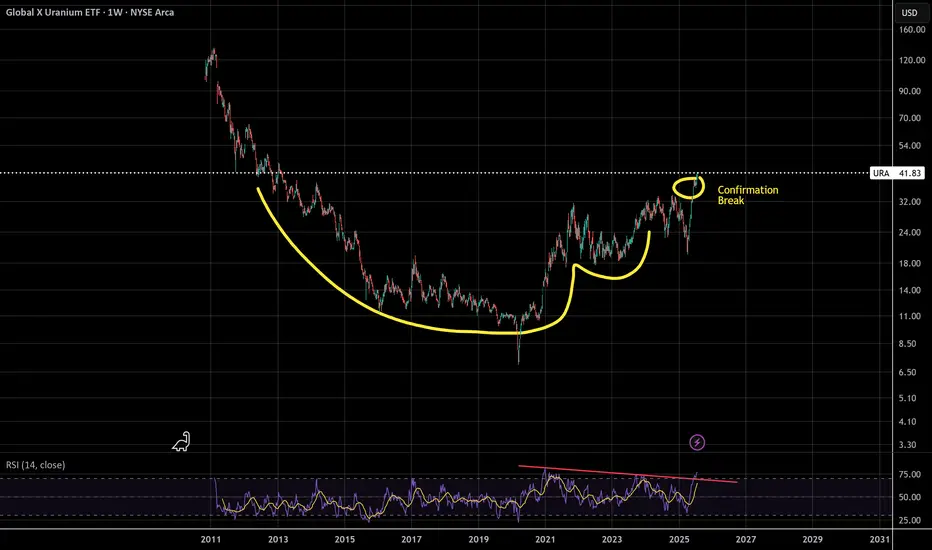
Messy Cup and HandleURA continues to pump as nuclear energy speculation goes wild but be careful, if tech goes down it may just take down nuclear with it. Tariffs can also cause a massive price swing, my guess is that if Canada is tariffed the cost of URA will go through the roof
Key stats
About Global X Uranium ETF
Home page
Inception date
Nov 4, 2010
Structure
Open-Ended Fund
Replication method
Physical
Dividend treatment
Distributes
Distribution tax treatment
Qualified dividends
Income tax type
Capital Gains
Max ST capital gains rate
39.60%
Max LT capital gains rate
20.00%
Primary advisor
Global X Management Co. LLC
Distributor
SEI Investments Distribution Co.
URA offers exposure to a broad range of companies involved in global uranium mining and the production of nuclear component that are pure-play or have large absolute revenues in the uranium industry. This includes those in extraction, refining, exploration, or manufacturing of equipment for the uranium and nuclear industries. The index is reconstituted semi-annually. Prior to May 1, 2018, the fund tracked the Solactive Global Uranium Index. The fund announced the underlying index will change to the Solactive Global Uranium & Nuclear Components Index during the third quarter of 2018.
Related funds
Classification
What's in the fund
Exposure type
Non-Energy Minerals
Producer Manufacturing
Stock breakdown by region
Top 10 holdings
Uranium miners in relation to energy and adjusted for spot priceThe Miners keep making more and more money.!
They could become cash cows

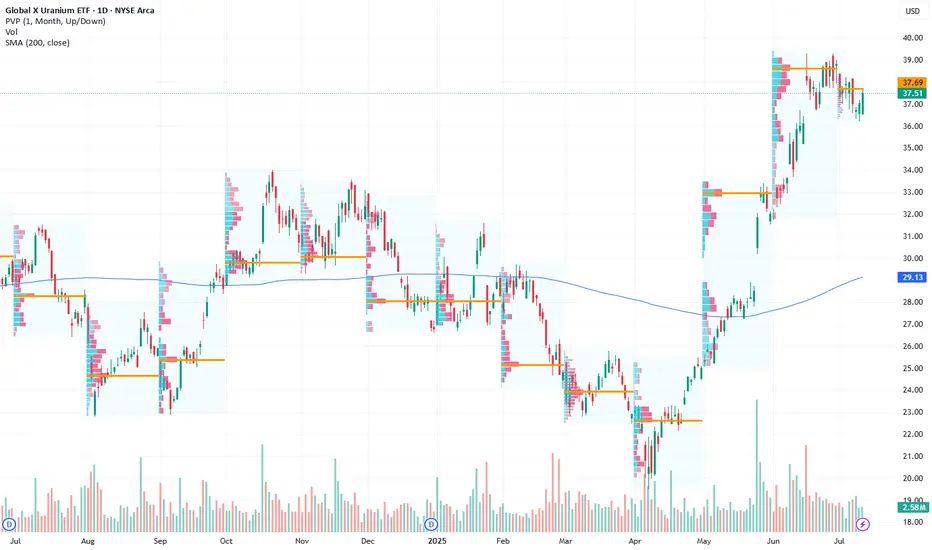
Global X Uranium ETF: Positioned for Growth Amid Rising Nuclear Current Price: $37.51
Direction: LONG
Targets:
- T1 = $39.00
- T2 = $40.50
Stop Levels:
- S1 = $36.50
- S2 = $35.75
**Wisdom of Professional Traders:**
This analysis synthesizes insights from thousands of professional traders and market experts, leveraging collective intelligence to identify
URA Long CallURA and CCJ are sitting at Volume Support and Darvas support levels.
Prices have also set up a minor low signal.
The trend has started to move to sideways, would would be confirmed today. Therefore, we need to be more aggressive in our stop loss and profit target. I like a move back up to the $38

Uranium The Epic Explosion!Global uranium demand is up to rise about 28% by 2030, driven by clean-energy pushes, nuclear restarts (e.g., Japan), and advanced modular reactors
Kazakhstan’s largest producer, Kazatomprom, cut its 2025 production forecast by ~17% due to logistical hurdles and resource constraints
Iran signaled

This Just Went Nuclear - Explosive Move!Uranium prices have surged due to several key factors:
- Increased demand for nuclear energy – Many countries are expanding nuclear power to meet clean energy goals.
- Geopolitical tensions – Supply disruptions from Russia and Niger have tightened the market.
- Underinvestment in uranium mining – Ye


URA at historic Support/Resistance level on WeeklyURA has hit the ~23.00 level. Since June 2021, the 23.00 level has provided resistance or support to URA 7 times, as shown by the yellow circles on the Weekly chart.
Entering a Long position with a upside target to another area of previous support and resistance at the ~27.00 area (green rectangle)

URA - Looking Good for Major MoveThe URA base appears to be a major reverse head and shoulders formation with price projections into the 40s. The move thus far appears to be impulsive with wave 5 targets also shown at the 1 and 1.618 levels. Still appears to be under the radar

Utilities vs. Uranium: Is the Nuclear Sector Gaining Momentum?Introduction:
Utilities AMEX:XLU have demonstrated strong performance over the past year, often signaling a "risk-off" market environment where investors seek safety. However, the rise of artificial intelligence (AI) and its impact on market dynamics may be challenging this traditional narrative.

See all ideas
Summarizing what the indicators are suggesting.
Oscillators
Neutral
SellBuy
Strong sellStrong buy
Strong sellSellNeutralBuyStrong buy
Oscillators
Neutral
SellBuy
Strong sellStrong buy
Strong sellSellNeutralBuyStrong buy
Summary
Neutral
SellBuy
Strong sellStrong buy
Strong sellSellNeutralBuyStrong buy
Summary
Neutral
SellBuy
Strong sellStrong buy
Strong sellSellNeutralBuyStrong buy
Summary
Neutral
SellBuy
Strong sellStrong buy
Strong sellSellNeutralBuyStrong buy
Moving Averages
Neutral
SellBuy
Strong sellStrong buy
Strong sellSellNeutralBuyStrong buy
Moving Averages
Neutral
SellBuy
Strong sellStrong buy
Strong sellSellNeutralBuyStrong buy
Displays a symbol's price movements over previous years to identify recurring trends.
Frequently Asked Questions
An exchange-traded fund (ETF) is a collection of assets (stocks, bonds, commodities, etc.) that track an underlying index and can be bought on an exchange like individual stocks.
URA trades at 39.49 USD today, its price has fallen −2.90% in the past 24 hours. Track more dynamics on URA price chart.
URA net asset value is 38.24 today — it's risen 0.53% over the past month. NAV represents the total value of the fund's assets less liabilities and serves as a gauge of the fund's performance.
URA assets under management is 4.02 B USD. AUM is an important metric as it reflects the fund's size and can serve as a gauge of how successful the fund is in attracting investors, which, in its turn, can influence decision-making.
URA price has risen by 1.92% over the last month, and its yearly performance shows a 54.62% increase. See more dynamics on URA price chart.
NAV returns, another gauge of an ETF dynamics, have risen by 0.53% over the last month, showed a 47.82% increase in three-month performance and has increased by 39.70% in a year.
NAV returns, another gauge of an ETF dynamics, have risen by 0.53% over the last month, showed a 47.82% increase in three-month performance and has increased by 39.70% in a year.
URA fund flows account for −226.25 M USD (1 year). Many traders use this metric to get insight into investors' sentiment and evaluate whether it's time to buy or sell the fund.
Since ETFs work like an individual stock, they can be bought and sold on exchanges (e.g. NASDAQ, NYSE, EURONEXT). As it happens with stocks, you need to select a brokerage to access trading. Explore our list of available brokers to find the one to help execute your strategies. Don't forget to do your research before getting to trading. Explore ETFs metrics in our ETF screener to find a reliable opportunity.
URA invests in stocks. See more details in our Analysis section.
URA expense ratio is 0.69%. It's an important metric for helping traders understand the fund's operating costs relative to assets and how expensive it would be to hold the fund.
No, URA isn't leveraged, meaning it doesn't use borrowings or financial derivatives to magnify the performance of the underlying assets or index it follows.
In some ways, ETFs are safe investments, but in a broader sense, they're not safer than any other asset, so it's crucial to analyze a fund before investing. But if your research gives a vague answer, you can always refer to technical analysis.
Today, URA technical analysis shows the buy rating and its 1-week rating is strong buy. Since market conditions are prone to changes, it's worth looking a bit further into the future — according to the 1-month rating URA shows the buy signal. See more of URA technicals for a more comprehensive analysis.
Today, URA technical analysis shows the buy rating and its 1-week rating is strong buy. Since market conditions are prone to changes, it's worth looking a bit further into the future — according to the 1-month rating URA shows the buy signal. See more of URA technicals for a more comprehensive analysis.
Yes, URA pays dividends to its holders with the dividend yield of 1.94%.
URA trades at a premium (0.05%).
Premium/discount to NAV expresses the difference between the ETF’s price and its NAV value. A positive percentage indicates a premium, meaning the ETF trades at a higher price than the calculated NAV. Conversely, a negative percentage indicates a discount, suggesting the ETF trades at a lower price than NAV.
Premium/discount to NAV expresses the difference between the ETF’s price and its NAV value. A positive percentage indicates a premium, meaning the ETF trades at a higher price than the calculated NAV. Conversely, a negative percentage indicates a discount, suggesting the ETF trades at a lower price than NAV.
URA shares are issued by Mirae Asset Global Investments Co., Ltd.
URA follows the Solactive Global Uranium & Nuclear Components Index. ETFs usually track some benchmark seeking to replicate its performance and guide asset selection and objectives.
The fund started trading on Nov 4, 2010.
The fund's management style is passive, meaning it's aiming to replicate the performance of the underlying index by holding assets in the same proportions as the index. The goal is to match the index's returns.