URNM eyes on $36.07: Golden Genesis to Mark Bottom or End BounceURNM trying to recover from a strong downtrend.
Currently testing a Golden Genesis fib at $36.07
Look for a Break-and-Retest to mark the Bottom.
.
Last Plot that called the TOP:
Also a Golden Genesis that marked the top.
============================================
.
URNM trade ideas

Uranium iH&SBig watch on Uranium.
I've taken the SPROTT ETF as an example as one of the largest ETFs, but this pattern can be seen in other uranium ETFs and large miners.
It's been hit hard lately, however fundamentals still seem strong with supply deficits hanging over the sector... hopefully providing a tailwind for positive price action.

How Low Could #URNM Go?In recent years, the URNM has suffered two (2) major downturns. If we mirror those two downturns forward, we can speculate on how much lower this ETF can go.

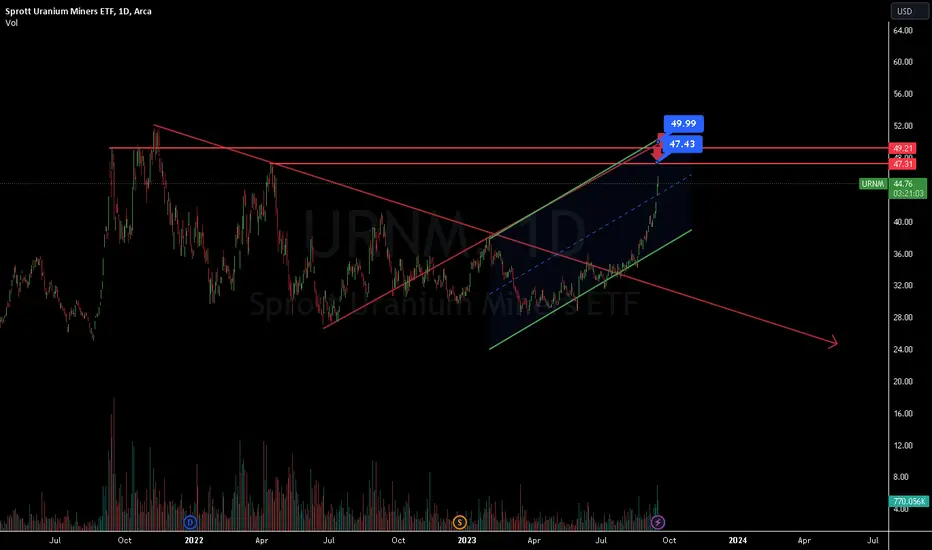
URNM heads up at $53.55: Golden Genesis fib is decision pointNuclear stocks have been exploding (lol).
This ETF has just hit a major landmark.
Recently proven Golden Genesis fib here.
It is PROBABLE we orbit this a few times.
It is POSSILBE that we break and continue.
It is PLAUSIBLE for a lower high of the top.
$ 53.55 is the exact level of interest.
$ 49.43 is first support, 46.88 stronger.
$ 60.22 is next target if break and run.
See Related Ideas below for other Nuclears.
======================================
.

Critical point for UraniumComing to decision time for Uranium.
Do we reload and go again, or are we confirmed new downtrend and into hibernation until a significant catalyst? AMEX:URNM

Uranium Slingshot Cheetah Pattern Incoming!!I have identified 3 different types of similar variations in URNM and URA ETFS which show us that we could be in a cusp of a huge explosive move to the upside.
These shakeout patterns are almost identical to each other with the same behavioural patterns before a big move to the upside. 2 humps which are almost like a H&S pattern followed by a huge flush down to break the upwards trend then bouncing off the 200 DMA with a complete reversal to the upside.
All of this is happening at the same time we are bottoming on the URNM/UX1! ratio with huge positive divergence on momentum indicators

Uranium stocks set to outperform everything in 2024 URNM is the largest pure play uranium miner etf in the world. It has been on a good run for about 10 months, but is still lagging the underlying commodity itself. I expect the equities to outperform physical uranium in a similar fashion to what happened during 2021. Spot uranium is approximately $100/lb at the moment, I fully expect it to reach all time highs ($140) and beyond in 2024. Anyone that produces uranium or will be soon (and there aren't that many to choose from) will be huge winners.
The uranium bull thesis is that there is a running supply deficit which has finally used up all of the excess uranium supply left in the wake of Fukushima and Japan shutting down it's reactors. They plan to restart almost all of them. China is furiously building nuclear power plants and world demand is set to increase dramatically in coming years/decades. Utilities don't really pay much attention to uranium prices as they have been able to get it for cheap for years and it is a tiny fraction of their operating costs. Uranium demand is almost perfectly price inelastic; utilities would pay 10x current prices without blinking as it would be far more costly to shut down a plant because you ran out of fuel.
What we are expecting is that there will eventually be a rush for everyone to secure supplies, and the prices people will be willing to pay could get silly.
While demand is growing, the real issues are on the supply side. The spiking uranium price indicates a shortage and there will not be enough meaningful new supply available from mining for 3 years at a minimum (NexGen's Arrow Deposit). Currently, major producers Cameco and Kazatomprom produce more than half of world supply, and are reporting difficulties in meeting production quotas due to many factors.
Two very important events that are imminent and could get this party really going:
1. Feb 1st, Kazatomprom plans to announce it's production goals for 2024/2025, which they have already warned the market will be revised lower from previous targets. This could be anywhere from 2-10% of ENTIRE GLOBAL SUPPLY that was expected and will not be available. I cannot stress how important this is. The market will react violently.
2. Feb 9th, Cameco will have it's 2023 earnings call. They've already reported production shortfalls and are rumored to be badly overbooked. This means that not only is some expected supply not going to be available, they are buying uranium themselves to meet contract obligations. THE WESTERN WORLD'S LARGEST URANIUM PRODUCER IS BUYING URANIUM BECAUSE THEY DON'T HAVE ANY TO SELL. Absolutely bonkers.
Another likely catalyst is HR1042, the bill to ban russian uranium. It's already passed the house and Ted Cruz is the only holdout in the Senate. Not counting on this one, but it doesn't matter.
In conclusion: there is a supply crunch of one of the most important strategic minerals on earth and it will not be fixed for many years. If I am correct, uranium mining stocks will outperform every other asset class for 2024 and beyond. Best odds to make life changing returns you might ever get in a lifetime. I'm all in, will you be?
Thanks for reading my novel, I am very passionate about this subject. Please feel free to ask any questions!
Cheers

URNM moving on up We look to be completing a short term corrective wave here, turning long term resistance into support coinciding with URNM finding support at the .382 Fib Retracement level last week. While I don't love this recent week's candle I'm not too concerned and will look to top up should we touch the .5 and .618 Fib Retracement levels over the next week or so.
Price targets for the next move up marked at the top of the channel and would anticipate once either of those are reached we find support around the circle on the lower band of the channel which sits between the .382 and .618 of both upper targets.
I believe we are at a similar point in this move to around November - December of 2020 seen below:
Exciting times in the Uranium sector from a Macro perspective with more and more reasons to be bullish every week. Spot price is heading up and word on the street is Utilities are aware and expect around $100 per lb in the not too distant future.

URNM: Immediate potential to 55+, but if price breaks 10w MA......I cannot rule-out one final macro-decline wave towards support area 25-20.
I like the impulsive move from Mar. 2020 bottom towards Nov 2021 top, that had almost perfect match with the key Fibonacci retracements. Especially notice how Nov top at 51.75 coincides with 1.00% ext of wave (1) projected from wave (4) and near first key resistance zone of 1.764% (of w.(1) from wave (2)).
Though the long lasting correction from Nov'21 highs doesn't look finished, due to advance from mid-term Jul'22 lows having yet only three waves, I still can entertain bullish (diagonal) set-up if price manages to hold 10W MA, consolidate around Sep'23 highs and break out above 50 resistance line (as per the green count).
I also like how price got volume support while touching the 10W during local correction from the Sep'23 highs, showing that there is potential interest from institutional money around that area.
Trading plan: I have entered initial long position, with todays break-out above the cheat pivot area of 44.75. I will be quick exiting with small single digits loss, if price will be able to follow through the following days.
Important notice: Elliot waves and fibonacci retracements are a very subjective form of analysis and I don't personally trade out of them. I use them only for the purpose of gauging structural potential of any assets, that allows me to put more confidence when low-risk trading set-up emerges. Author's personal multi-years trading experience convinced him that analysis and opinion doesn't pay, only price pays and that one shall not ever argue with price.

Uranium Miner ETF 2 Year Resistance Breakout UPDATEHi Guys! This is a Technical Analysis Update on Sprott Uranium Miners ETF (URNM) on the 1 Week Timeframe.
URNM was able to BREAK Above the 2 year Resistance line and close Friday with a Strong body candle close.
It was accompanied with a VOLUME SPIKE, which shows follow through and supports price action.
This is the 1st step in attempting a Trend Change.
2nd MOST important step = Confirming the breakout = Testing Support and Succeeding
So this upcoming Week to couple weeks is crucial for us to stay above Resistance line.
Not only are we ABOVE the Resistance line but we also CLOSED ABOVE the 100 SMA. Again if we confirm SUPPORT, we will now have the backing of 2 MAJOR Resistance turned SUPPORT zones.
Prior to this current move we also maintained SUPPORT on the 50 SMA for 3 weeks before moving up.
In the coming weeks, it is likely we also have a GOLDEN CROSS occur.
This is when the 50 SMA CROSSES ABOVE the 100 SMA. This leads to a confirmation of BULL TREND. So i'd we watching for this.
Bullish Momentum is also currently PRESENT, expressed through the STOCH RSI and MACD.
One thing to OBSERVE aggressively is the MACD.
Particularly on the size of the histogram bars and the slope of the blue/orange line. We are ABOVE the 0 level, universally this leads to BULLISH MOMENTUM and UPTRENDS.
________________________________________________________________________________
Thank you for taking the time to read my analysis. Hope it helped keep you informed. Please do support my ideas by boosting, following me and commenting. Thanks again.
Stay tuned for more updates on URNM in the near future.
If you have any questions, do reach out. Thank you again.
DISCLAIMER: This is not financial advice, i am not a financial advisor. The thoughts expressed in the posts are my opinion and for educational purposes. Do not use my ideas for the basis of your trading strategy, make sure to work out your own strategy and when trading always spend majority of your time on risk management strategy.

URNMHi..everybody URNM is really susceptible to retrace from that peak.....dont jump on long boat now please consider now you should prepare yourself to gain from tiny short position ....Learn how to trade and educate yoursef that is the only way to rescue you in ruthless market.....
Goooooooos Luuuuuuck
This look like it go up!Buy this and you shall make money.
Bullish looking chart. Lots of consolidation, looks like it's finally breaking out.
Up up and away!

Uranium Miners: No more mining for now ⛏️The Uranium Miners ETF has now reached the level where we expect the top of the magenta wave (b). Based on this development, we expect the wave to end and transition to significant declines, which should go below $24 and end the turquoise wave 2. If, contrary to our scenario, we see a rise above the resistance at $41.23, our alternative would activate with a probability of 35% and within the magenta wave Alt.(b), the next target would be the magenta target zone between $49.72 and $57.67.

URNM wants to go upThe trendline has finally been broken (orange line on the chart). Let's see how much upside we can get.

URNM 2H 2023, 3d ChartGoing along with my previous charts on UEC and URA, URNM is breaking out, with a steady RSI >50 and increasing volume.
With the geopolitical risk affecting uranium supply and the general bullish charts across the uranium etfs and miners, URNM is one to keep an eye on.

$URNM Breakout Trade IdeaI was already bullish on AMEX:URNM and AMEX:URA ETFs and seeing these diagonal SR lines got broken was enough for me. I am concerned that this is "diddling in the middle" so very important it stays above red line at $35.26 imo. Plan is to move stop loss up.

URNM - LONG SWING Trade Long DurationURNM is an ETF tracking uranium miners. Uranium based nuclear energy is now
hyped as a partial solution to the climate change crisis and the dependence on
fossil fuels. My thesis is that miners will enjoy a resurgence in demand for uranium
and with supply dependent on their work they will enjoy increased revenues
and margins above relatively fixed overhead and costs. The daily chart is
supportive of this idea. I see a symmetrical triangle here with both upside and
downside potential. Fundamentals diminish the downside potential substantially.
In the past month, price has moved above the POC line of the long-term volume profile. I have
drawn in pivot lines from which to plan targets in an upside move.
I see the upside as about 50% in the upcoming year based
on the chart but likely more if supply-demand imbalances have an impact. Taking
call options at various strikes out of the money near these upside targets is a
high consideration.

Uranium Miner ETF Breaking a 2 year Resistance TrendHi Guys! This is a Technical Analysis on Sprott Uranium Miners ETF (URNM) on the 1 Week Timeframe.
We are currently in the process of BREAKING OUT of the Major Resistance Trend that started from November 2021.
Just KEEP in MIND -> The candle closes end of the trading week. So if end of week we are still ABOVE the resistance line thats 50% of the work done for TREND CHANGE to occur.
The other 50% to reach 100% of completing the job is the observation of CONFIRMATION above the resistance and having it turn SUPPORT.
Once we do that, we can start moving towards TARGET 1.
Notice also how for multiple weeks straight we tested SUPPORT on the 21 EMA, and now we are moving above it. This is a sign of BULLISHNESS
Remember we must wait for CONFIRMATION above the resistance. Without it, the chances of a FAKEOUT are probable.
STOCH RSI is showing that BULLISH momentum is entering. As long as we maintain this, moving up above the 80 level. It INCREASES the PROBABILITY that we complete the TREND CHANGE above the Major Resistance Trendline.
RSI is also in the process of a Trend Change. Notice how we tested SUPPORT and bounced off the BLACK line.
Stay tuned for more updates on URNM in the near future.
Thank you for taking the time to read my analysis. Hope it helped keep you informed. Please do support my ideas by boosting, following me and commenting. Thanks again.
If you have any questions, do reach out. Thank you again.
DISCLAIMER: This is not financial advice, i am not a financial advisor. The thoughts expressed in the posts are my opinion and for educational purposes. Do not use my ideas for the basis of your trading strategy, make sure to work out your own strategy and when trading always spend majority of your time on risk management strategy.

Levels of Interest $URNMTA on levels of interest for $URANM
Please note that this is a preliminary research paper and you should continue to do your own research (DYOR). Information about assets can change rapidly, and it's essential to stay updated with the most recent developments.
Notes on how I personally use my charts/NFA:
Each level L1-L3 and TP1-TP3 (Or S1-S3) has a deployment percentage. The idea is to flag these levels so I can buy 11% at L1 , 28% at L2 and if L3 deploy 61% of assigned dry powder. The same in reverse goes for TP. TP1: 61%, TP2:28% and TP3:11%. If chart pivots between TP's, in-between or in Between Sell levels these percentages are still respected. I like to use the trading range to accumulate by using this tactic.
Just my personal way of using this. This is not intended or made to constitute any financial advice.
This is not intended or made to constitute any financial advice.
FED Macro Situation Consideration:
All TP's are drawn within the context of a return to FED neutral policy. I do not expect these levels to be reached before tightening is over.
NOT INVESTMENT ADVICE
I am not a financial advisor.
The Content in this TradingView Idea is for informational purposes only, you should not construe any such information or other material as legal, tax, investment, financial, or other advice. Nothing contained within this idea constitutes a solicitation, recommendation, endorsement, or offer to buy or sell any securities or other financial instruments in this or in in any other jurisdiction in which such solicitation or offer would be unlawful under the securities laws of such jurisdiction.
All Content on this idea post is information of a general nature and does not address the circumstances of any particular individual or entity. Nothing in the idea/post constitutes professional and/or financial advice, nor does any information on the idea/post constitute a comprehensive or complete statement of the matters discussed or the law relating thereto. You alone assume the sole responsibility of evaluating the merits and risks associated with the use of any information or other Content on the idea/post before making any decisions based on such information.

Uranium markets tightening up for volatility...URNM looking good.
Alot of tightening for YEARS.
This means volatility is probably on the way.
On top of that it is a relatively untouched narrative with a powerful idea in nuclear energy behind the markets.
Currently at a great position for buys.

UraniumUranium miners ETF on the Weekly chart
Massive bull flag, patience should be rewarded
- retracement of an impulse wave
-waiting for triangle break out
-countries moving back into nuclear power
None of this should be interpreted as financial advice, I am not a professional or certified financial adviser! all charts, and or analysis' are my personal opinions and observations only!

urnm one more low ahead?Looks like a little more room to the downside.
Before we will head much higher.

Is $URNM getting ready to pop?Confirmations:
- Double bottom
- Rising OBV
- Rising trend lines
- Extremely low Put/Call Open Interest Ratio for 5/19/23:
Put Open Interest Total 1,368
Call Open Interest Total 5,718
Put/Call Open Interest Ratio 0.24
