The MSCI World index sets a new all-time record!The MSCI World stock market index set a new all-time record during the trading session of Monday June 2, wiping out the entire stock market shock of February/March, which saw the global equity market lose 20%. This technical signal still needs to be confirmed at the end of the week at the next weekly technical close. If this bullish technical break were to be confirmed, then this would be a very positive signal for the global equity market, which is still hoping that trade diplomacy will lead to solid trade agreements between the USA and its main trading partners (China and the EU).
The chart below shows the weekly Japanese candlesticks of the MSCI World index.
1) Composition and calculation of the MSCI World index
The MSCI World Index (Morgan Stanley Capital International World Index) is a benchmark stock market index that measures the performance of large- and mid-cap equities in developed countries. Here are the main elements of its composition:
The MSCI World Index is a benchmark global stock market index that measures the performance of large- and mid-cap equities in 23 developed countries. Created by Morgan Stanley Capital International, it offers a global view of the equity markets in the most advanced economies. Among the countries included are the United States, Japan, the United Kingdom, France, Germany, Canada and Australia. The index comprises some 1,600 companies, with a strong dominance of the USA, which accounts for almost 70% of its total weighting. The most represented sectors are information technology, healthcare, financial services and consumer discretionary.
The MSCI World is calculated using a weighting method based on free-float market capitalization, i.e. taking into account only those stocks actually available for purchase on the markets. This means that companies with a higher market value and a larger free float have a greater influence on the index's performance. The MSCI World is updated regularly to reflect market developments and the entry or exit of companies.
Although it offers broad geographic diversification, it does not include emerging countries; these are covered by the MSCI ACWI index, which is also close to setting a new all-time record and is 13% composed of emerging countries (China, India, etc.).
2) Trade diplomacy and the FED's monetary policy outlook are key to keeping the global equity market bullish in the months ahead.
Trade diplomacy and the FED's monetary policy outlook are closely linked fundamental factors which have a direct impact on global equity market trends.
While the US inflation rate continues to trend towards the FED's 2% target, the FED is waiting for trade agreements to be signed to ensure that the risk of a second wave of inflation is averted, so that it can resume cutting the US federal funds rate.
These two fundamental conditions are essential if the global equity market is to confirm its new record highs over the coming months.
DISCLAIMER:
This content is intended for individuals who are familiar with financial markets and instruments and is for information purposes only. The presented idea (including market commentary, market data and observations) is not a work product of any research department of Swissquote or its affiliates. This material is intended to highlight market action and does not constitute investment, legal or tax advice. If you are a retail investor or lack experience in trading complex financial products, it is advisable to seek professional advice from licensed advisor before making any financial decisions.
This content is not intended to manipulate the market or encourage any specific financial behavior.
Swissquote makes no representation or warranty as to the quality, completeness, accuracy, comprehensiveness or non-infringement of such content. The views expressed are those of the consultant and are provided for educational purposes only. Any information provided relating to a product or market should not be construed as recommending an investment strategy or transaction. Past performance is not a guarantee of future results.
Swissquote and its employees and representatives shall in no event be held liable for any damages or losses arising directly or indirectly from decisions made on the basis of this content.
The use of any third-party brands or trademarks is for information only and does not imply endorsement by Swissquote, or that the trademark owner has authorised Swissquote to promote its products or services.
Swissquote is the marketing brand for the activities of Swissquote Bank Ltd (Switzerland) regulated by FINMA, Swissquote Capital Markets Limited regulated by CySEC (Cyprus), Swissquote Bank Europe SA (Luxembourg) regulated by the CSSF, Swissquote Ltd (UK) regulated by the FCA, Swissquote Financial Services (Malta) Ltd regulated by the Malta Financial Services Authority, Swissquote MEA Ltd. (UAE) regulated by the Dubai Financial Services Authority, Swissquote Pte Ltd (Singapore) regulated by the Monetary Authority of Singapore, Swissquote Asia Limited (Hong Kong) licensed by the Hong Kong Securities and Futures Commission (SFC) and Swissquote South Africa (Pty) Ltd supervised by the FSCA.
Products and services of Swissquote are only intended for those permitted to receive them under local law.
All investments carry a degree of risk. The risk of loss in trading or holding financial instruments can be substantial. The value of financial instruments, including but not limited to stocks, bonds, cryptocurrencies, and other assets, can fluctuate both upwards and downwards. There is a significant risk of financial loss when buying, selling, holding, staking, or investing in these instruments. SQBE makes no recommendations regarding any specific investment, transaction, or the use of any particular investment strategy.
CFDs are complex instruments and come with a high risk of losing money rapidly due to leverage. The vast majority of retail client accounts suffer capital losses when trading in CFDs. You should consider whether you understand how CFDs work and whether you can afford to take the high risk of losing your money.
Digital Assets are unregulated in most countries and consumer protection rules may not apply. As highly volatile speculative investments, Digital Assets are not suitable for investors without a high-risk tolerance. Make sure you understand each Digital Asset before you trade.
Cryptocurrencies are not considered legal tender in some jurisdictions and are subject to regulatory uncertainties.
The use of Internet-based systems can involve high risks, including, but not limited to, fraud, cyber-attacks, network and communication failures, as well as identity theft and phishing attacks related to crypto-assets.
URTH trade ideas

OMICRON And The Markets, NASDAQ Builds Massive Reversal-Pattern!Hello,
Welcome to this analysis about the stock-market-index NASDAQ and the 2-day timeframe perspectives. When considering the stock market overall and the current developments it has to be remarked that we are in a precarious situation as the real economy is still damaged by the corona pandemic which began last year, while the stock market recovered exceptionally and in a fast pace there are still many businesses suffering from the crisis and when looking at the current dynamic we can watch that with the upcoming omicron variant of the coronavirus it should not be underestimated that a dramatic increase of pandemic activity can also lead to shacky grounds in the stock market setting up for a much bigger bearish pullback. We also see accelerating inflation which in fact is a result of the huge amounts of money printed over the route of last year 2021 in which the money stock increased exponentially this gave fuel for this increasing inflation and therefore when it goes on like this the inflation can increase further, all these factors should not be kept by the side and as when looking at my chart we can watch there how the NASDAQ Index is building this main ascending-wedge-formation with the coherent wave-count within the formation and the waves A to D already completed, now with the last wave-E remaining this is likely to finalize the whole wave-count and move into the upper resistance-cluster from where a pullback to the downside will be highly possible, when this pullback sets up and the index moves below the lower-boundary it will be the confirmation of this whole ascending-wedge and the index will move on further to the downside to reach out the target-zones from where the dynamic needs to be elevated again, if the index forms a new bear-flag in this zone a bearish continuation is also possible.
In this manner, thank you for watching the analysis, it will be great when you support it with a like, follow and comment for more upcoming market analysis, all the best!
"The high destiny of the market is to explicate, rather than to speculate."
Information provided is only educational and should not be used to take action in the markets.

MSCI World looking bearish on weeklyFailed at trend resistance $120 three times.
nice arc with multiple touches
global liquidity anticipating the move down? see link below
twitter.com

MSCI World Index Fund WCA - Possible INV H&SIndex: MSCI World Index Fund
Introduction:
Hello everyone! Today, we are looking at the MSCI World Index Fund to gain a broader perspective on the global equity market environment. Based on our current analysis, we can see the formation of a classic technical pattern, signaling a potential reversal from the preceding downtrend.
Analysis:
Over the past 371 days, the index has seemingly been forming an inverted head and shoulders pattern, a well-known reversal pattern suggesting a change from a downtrend to an uptrend. The horizontal neckline of this pattern lies at 120$. While the symmetry between the shoulders isn't perfect, it's worth noting that when the right shoulder is slightly higher than the left one, this is often seen as a bullish sign.
Furthermore, the right shoulder has formed distinctly above the 200 EMA, adding weight to the potential bullish reversal. Currently, the price appears to have broken out above the neckline, paving the way for a calculation of a possible price target upon the successful closing of the weekly candle. However, it's crucial to remember that the weekly candle must close above the neckline; otherwise, we could be dealing with a premature breakout.
Assuming a valid breakout, our calculated price target would be 142, equating to a potential price increase of approximately 18.5%. This provides a favorable opportunity to explore long setups in general.
Conclusion:
The MSCI World Index Fund's technical analysis points to a potentially bullish reversal. Should the current breakout confirm, the ensuing uptrend could present opportunities for investors looking for long positions.
As always, remember to conduct your own due diligence and implement appropriate risk management strategies when investing.
Thank you for tuning into this analysis. Please like, share, and follow for more insights into the market. Happy trading!
Best regards,
Karim Subhieh

To everything there is a season ...To everything there is a season ... a time to cast away stones and a time to gather them ...
Stock markets do not need a great economic environment to rise noticeably.
When reality succeeds in outperforming low expectations, a sustainable tailwind is created.
In this sense, the MSCI World Index managed to deliver a very good start to the year despite mixed data.
Given the abundant evidence that equity markets are "ahead" of the reportings, earnings performance is useless as an indicator of upcoming equity market performance.
Equity markets look ahead and price in the likely future of the next 3 to 30 months.
And as long as the "pessimism of disbelief" influences investor sentiment, equity markets will continue to receive tailwinds in the form of positive surprises.
Already at the beginning of 2023, the stock markets sent the first signals that the accumulated pessimism from 2022 was slowly subsiding.
As a rule, a sceptical phase follows, which may well last longer - and gives the stock markets a good chance to rise sustainably.
As long as expectations remain low, reality can surprise positively without much effort.
My thought on this: Maybe we are in such a phase right now...
It is possible that the current situation and isolated banking crises should be seen in this context. Don't let the panic reports drive you crazy, trade the market. Things do not look that bad (yet). It is possible that the opposite pole, the most favourable entry point, will be reached shortly.
->No trading advice, use your own judgement.

What in the world?Here's a comparison list of iShares regional ETF's to see a visual of what's going on in the world equity markets. This is a 4hr chart, 2 month view. I can narrow down a current or past regional trend depending on the time frame I choose.
URTH Developed World
EEM Emerging Markets
EUSA United States of America
IEUR Europe
MCHI China
KWT Kuwait
EWQ France
EIS Israel
INDA India
EWJ Japan
EWZ Brazil
EWW Mexico
EZA South Africa
KSA Saudi Arabia
TUR Turkey
EWC Canada
EWU United Kingdom
EWL Switzerland
EWG Germany
EWP Spain
QAT Qatar
UAE United Arab Emirates
EWD Sweden
EWN Netherlands
EDEN Denmark
EWI Italy
EPOL Poland
EIRL Ireland
EWK Belgium
EWY South Korea
EWT Taiwan
EWA Australia
EWS Singapore
THD Thailand
ENZL New Zealand
EPHE Philippines
EWM Malaysia
Do your own due diligence, your risk is 100% your responsibility. This is for educational and entertainment purposes only. You win some or you learn some. Consider being charitable with some of your profit to help humankind. Good luck and happy trading friends...
*3x lucky 7s of trading*
7pt Trading compass:
Price action, entry/exit
Volume average/direction
Trend, patterns, momentum
Newsworthy current events
Revenue
Earnings
Balance sheet
7 Common mistakes:
+5% portfolio trades, capital risk management
Beware of analyst's motives
Emotions & Opinions
FOMO : bad timing, the market is ruthless, be shrewd
Lack of planning & discipline
Forgetting restraint
Obdurate repetitive errors, no adaptation
7 Important tools:
Trading View app!, Brokerage UI
Accurate indicators & settings
Wide screen monitor/s
Trading log (pencil & graph paper)
Big, organized desk
Reading books, playing chess
Sorted watch-list
Checkout my indicators:
Fibonacci VIP - volume
Fibonacci MA7 - price
pi RSI - trend momentum
BBMC - bollinger bands
TTC - trend channel
AlertiT - notification
tickerTracker - MFI Oscillator
www.tradingview.com


The Asian vs the Global marketThis has not happened for a very long time. Huge divergence. A significant drop in Asian stocks suggests a systemic selloff in global equities ahead.
Best regards, EXCAVO


Macroeconomics - $URTH $MTUM $VLUE - The Holy GrailMSCI World ETF is at a double top at the ATH...
"Next Tuesday marks the 12-month anniversary of the MSCI AC World Value Index’s eight-year low, a key timeframe that many quantitative models use to screen for momentum shares to buy.
...
Momentum bets are popular within the roughly $2 trillion systematic community, which groups stocks together by their characteristics, an approach known as factor investing. Exchange-traded funds tied to momentum command $20 billion in the U.S. alone.
...
Some portfolios rebalance monthly. Others, including major momentum ETFs, do so every quarter or half year -- suggesting more cash will join the cyclical rotation at the end of this March.
...
The violent downdraft (and subsequent rally) of last March is poised to create the most turbulent rebalance ever for momentum-based strategies
...
A portfolio that buys the 100 top gainers in the S&P 500 would see the largest turnover in at least three decades if it rebalanced in March.
...
All this could be absorbed by the market comfortably on a typical day. But if enough quants sell the same stock at the same time, there’s always the risk of an increase in trading costs and price volatility."
- Bloomberg
319 quad witching OpEx, and momentum factor 1 year rebalancing aligning hints at a non-trivial probability of high volatility!
At the end of the day, BlackRock's quants decide what goes into these ETFs. It has been interesting indeed to follow theirs and the Morgans' trail.
Let's see if this period is the catalyst for "The Blood Moon"...
GLHF
- DPT


MSCI Country Performance in 2020Here’s a chart of how some foreign equity markets around the world have performed relative to each other throughout 2020. Its based on iShares MSCI ETF performance.
This year’s correction and recovery have been unique from prior corrections in that the catalyst was a pandemic that impacted every country in the world, but at different times. Observing the chart, you can find where some countries underperform or outperform others as they go into and out of lockdowns and other measures that impacted the local markets.
There was an upturn in markets around October 28 (a bottom for US markets on 10/30). Around the same time several regions went back into lock downs early, with the United States refraining from further lock downs until some states pivoted heading into late November and asked for business to shut doors. It’s clear that the countries that locked down early have markets that are accelerating as investors see those economies likely to emerge from slowdowns faster.
Similarly, you can look at a comparison of currencies and see similar trends. Below is a currency comparison since the beginning of 2020.
Finally, below is world currencies since October 28.
It’s a curiosity, if not a pointer to what foreign countries to build some portfolio exposure. Most likely, the US market will emerge in relative strength once we clear the current pandemic wave and have a vaccine in place.

Critical view at world economyFinancial planners and news tooted alot of news in the last weeks, which are novel to anyone of us.
Not playing devils advocate here, one could generally assume planners would like to keep clients funds and news are overselling events emotionally, to create attention.
Taking a critical look might give clarity in troublesome times.
Ive developed two rather simplified scenarios, namely bull (green) and bear (red).
To be fair, each should be called bear, because its highly unlikely to see growth this year (sp and other index ratings seem to be slashed by analysts on the daily now).
Regarding to the bull scenario, we could likely bounce back into ema region.
pro
-goverments are finaly mobilizing accordingly (looking at you, trump, johnson)
-china seems to be getting back on track again
-effective medication might be available soon, who knows
The bear told me however, we cant comprehent real damage today
pro
-banks wont offer credits to small businesses as promised by governments (germany for example), because they dont want to risk credit default
-people underestimate dangers and stop preventing virus care, second huge outbreak
-fed , european central bank already blew their ammunition - more cash does not cure infections, unfortunatelly - they are not dry, but just creating more money is unreasonable- "bad" companies need to die one way or the other in captialistic systems
-ripple effect accumulated to sum of those events
-ripple scenario : people go full anarchy, recognising their real estate is dilluted, tax payers have to pay all this mess, over 11 years of bullrun flipped into massive wealth-burn (full bananas bear scenario, just a thought exercise)
keep in mind however:
-these are some of the best companies overall, technology and such, high margin, lowish maintenance - the rest will dump much harder
In case 1, I would really consider cashing out and reinvesting at a cheaper point in time, as a long term investor - we hopefully not reach bottom again, but recovery above the next high will take its time - lower overall bip is not priced in yet
In case 2 ? Idk, guns are pretty illegal in europe, so I rely on your opinion on how to survive this mess!
However Id have an eye on cryptos, gold and funding local business or such!
Trade save and keep diamond_handz!


Dont get PANIC!!!! .. Its Corona Time [Eng/Ger]Watch in the past and Relax ! - It's normal "you think it will be Heavier than now".
I Think the next days will be Hard too, but in a term of 1year or more is it now very cheap.
Schau in die Vergangenheit der Börse und entspann dich etwas! - Es ist normal das du denkst es wird noch Krasser als jetzt.
Ich denke es wird in den nächsten Tagen noch ein auf und ab, besser bekannt als Konsolidierung (+/-0%) mit einem Draw down von bis zu +/- 4%.
Aber langfristig betrachtet ist es für mich jetzt schon eine Nachkauf Möglichkeit (mit einzelnen kleinen Positionen) welche ich langfristig halten werde.

Outrageous Prediction 2: Stagflation rewards value over growthUsing this fantastic chart to track how the 2020 outrageous predictions hold up over time: This is really one to watch - I personally believe that we have not yet topped out of the current liquidity cycle and so if this prediciton does come true it will only be after Q3 2020
"The iShares MSCCI World Value Factor ETF leaves the FANGS in the dust, outperforming them by 25%"
The world has now come full circle from the end of the Bretton Woods system, when it effectively shifted from a gold-based USD to a pure fiat USD system, with endless trillions of dollars borrowed into existence — not only in the US but all over the world. Each credit cycle has required ever-lower rates and greater doses of stimulus to prevent a total seizure in the US and global financial system. The mispricing of money and bailing out of zombies has seen productivity growth crater as low rates encourage chasing asset values higher and malinvestment in unprofitable unicorns such as Uber and WeWork. They also allow zombie, debt-laden companies to survive.
As the market narrative switches to stagflation, value companies and their solid, right here, right now earnings and dividends are highly prized over the stumbling growth companies, where weak growth weighs and where crazy high multiples were always about the mispricing of capital. The MSCI value ETF leaves the FANGS in the dust
www.home.saxo

Globale Rezession wird kommen... Früher oder später ist es so weit... derzeit in Welle 5 einer Elliot Impuls Bewegung --> Korrektur wird folgen

MSCI World- the world has hit the first historic level
- once this is proven or broken - we will know where to go
- in my opinion, the world cannot drive itself out without US
- US will be recognized soon as a key player and sooner the better...
Notes:
- - watch the shock and awe of this impulse
Also check the real deal: www.investing.com - just the top blew off ! YET !
- the world markets may see more crashes soon

World Stock' Index Clear Breakdown Weekly Preview 11/12/18Throughout history, there has been times to own stocks or paper assets,
and times when to go near them.. would be dangerous to your wealth.
In 2018, as the chart of the MSCI World Index shows,
stocks have begun the process of rolling over from historic highs.
There is indisputable evidence, that stock markets throughout the world,
are seeing liquidation, as the busted patterns in individual stock charts, show up, and take hold.
Has any one really looked closely at the Nasdaq 100 ..?
The premise here is that the public, has not yet recognized this profound change taking hold here.
They are still wishful believers who believe that better days, are just around the corner, once the correction.. exhaust itself.
Once the realization occurs in full view, to the crowd, that things are simply NOT..
going back to the way they once were, as evidence, parabolic stock chart patterns showing clear busts,
then the mass exodus from stock markets worldwide will begin in earnest.
Thanks to dedeburn on tradingview.com for his bright illumination, and same conclusions)
We are still early in the process, and it would not be inconceivable for stocks to have a dead cat bounce,to bring in more believers
HOWEVER, evidence is already showing up, that sharp price rallies, are meeting strong RESISTANCE, from trapped buyers above.
The world stock index URTH, clearly shows that price rally this fall, was not able to reclaim the price high peak from Feb.2018,
and has rolled over, and has recently made new LOWER LOWS in 2018.
To ignore what is going on around you can have fateful consequences.
Stock markets throughout the world have already been discounting the turn down.
The world is now a much more dangerous place for humanity.
Look around, And Ignore it ultimately in your financial house,
at your own peril.
THE_UNWIND
11/10/18
NEW YORK
World Index - How deep will the equities pullback be?Globally, not looking good after this week's close

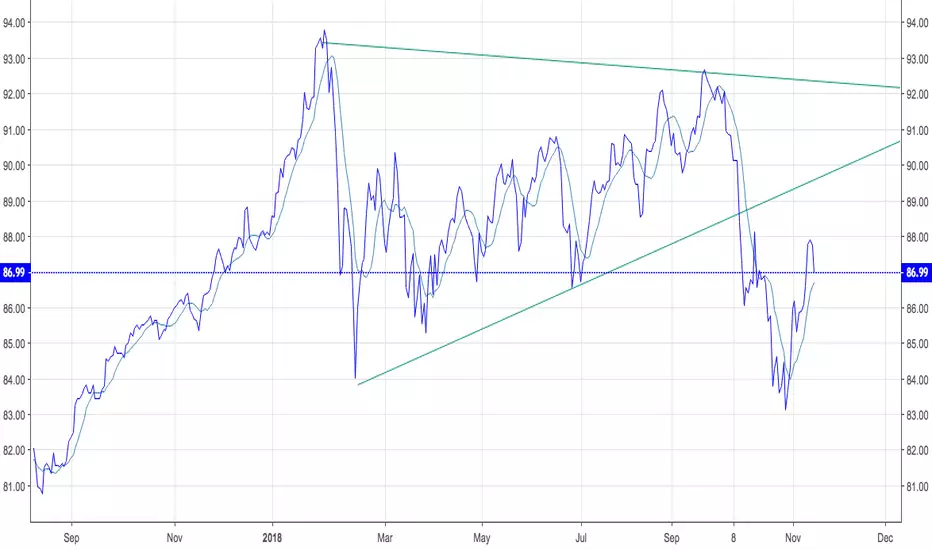
MSCI WORLD Possible Rebound Areas MSCI World may rebound at ~83.5$ / ~82$
New lows with good divergence, always good when looking for reverse action.

MSCI World Index Needs to Hold 85.90After a relentless break of all EMAs, the world index needs to hold 85.90 or it will open the way to 83.50 or 82 or even <80.

