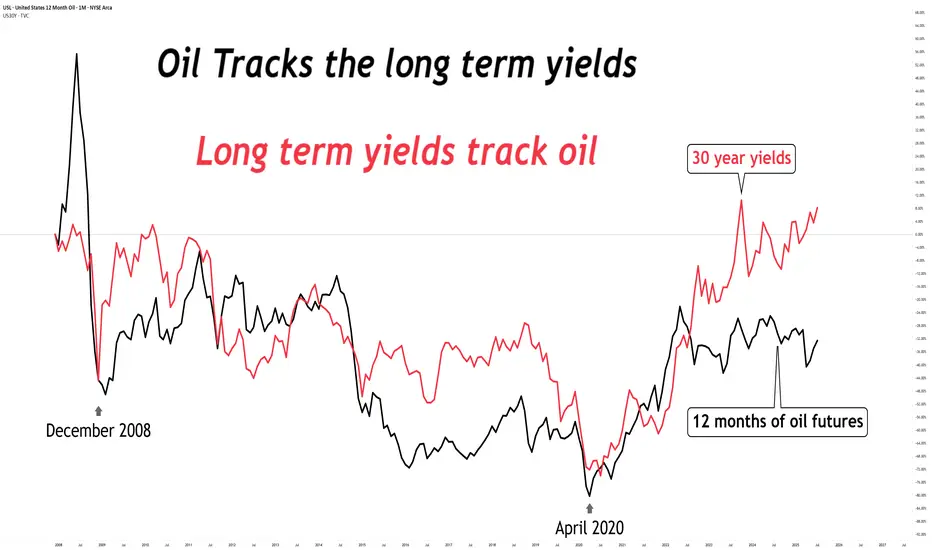
Oil tracks yields (or vice-versa)Looking at this chart...
Where do you think oil & long term yields are going?
Key stats
About United States 12 Month Oil
Home page
Inception date
Dec 6, 2007
Structure
Commodities Pool
Replication method
Synthetic
Distribution tax treatment
No distributions
Income tax type
60/40
Max ST capital gains rate
27.84%
Max LT capital gains rate
27.84%
Primary advisor
United States Commodity Funds LLC
Distributor
ALPS Distributors, Inc.
USL offers an alternative method of exposure to oil in a viable vehicle. The fund brings an alternative futures strategy to the table that's had some success. In an effort to beat contango the decay of exposure to oil when the futures curve is up sloping the fund takes a position in 12 different futures contracts, one for each upcoming month. This will mean it will have less sensitivity to short-term moves in spot oil. Investors should consider using limit orders to manage spreads. USLs legal structure isnt unusual in the commodities space, but it does change the tax structure and result in a K-1 at tax time.
Related funds
Classification
What's in the fund
Exposure type
Cash
Futures
Bonds, Cash & Other100.00%
Cash50.63%
Futures49.37%
Top 10 holdings
Bullish pattern morphing into existence for OilWhat a beautifully bullish pattern morphing into existence for crude oil !!!
With price being contained for over 3 years below that continuation breakout line, the 12 quarter moving average is squeezing, putting upwards pressure.
Oh boy, this could explode anytime soon ;-)


12 month oil=> 12 month crude oil breaking out on weekly chart <=
The mainstream media head line news will flood us once the price is close to its targets... late, like usual.
#CrudeOil #Inflation #Commodities #Gold #Silver

crude oilAnother VERY BULLISH setup for #CrudeOil ...
early breakout line
continuation breakout line

LONG, BULLISHUSL could hit $18.50 to fill in the gap. Be careful on news regarding OPEC.
Support might be tapped a few times and then price should go up from here. Move stop losses in profit and keep a tight stop loss.

USL Long, option trade with big stop bufferUSL Long, option trade with big stop buffer
Try to accumulate oil long position at bottom in next two months.
Stock Entry: Below 10.4
Stop: 9.6 (down to new low)
Target1: 14.2; risk/reward=1:3
Target2: 19; risk/reward=1:18
In option trade, I bought Oct Call Butterfly C11/16/21 (Delta 0.15), li


#USL #short #stockUSL has formed a small double top on the daily.Indicators pointing down. I see two possible targets, both with decent RRR.

See all ideas
Summarizing what the indicators are suggesting.
Oscillators
Neutral
SellBuy
Strong sellStrong buy
Strong sellSellNeutralBuyStrong buy
Oscillators
Neutral
SellBuy
Strong sellStrong buy
Strong sellSellNeutralBuyStrong buy
Summary
Neutral
SellBuy
Strong sellStrong buy
Strong sellSellNeutralBuyStrong buy
Summary
Neutral
SellBuy
Strong sellStrong buy
Strong sellSellNeutralBuyStrong buy
Summary
Neutral
SellBuy
Strong sellStrong buy
Strong sellSellNeutralBuyStrong buy
Moving Averages
Neutral
SellBuy
Strong sellStrong buy
Strong sellSellNeutralBuyStrong buy
Moving Averages
Neutral
SellBuy
Strong sellStrong buy
Strong sellSellNeutralBuyStrong buy
Displays a symbol's price movements over previous years to identify recurring trends.
Frequently Asked Questions
An exchange-traded fund (ETF) is a collection of assets (stocks, bonds, commodities, etc.) that track an underlying index and can be bought on an exchange like individual stocks.
USL trades at 36.11 USD today, its price has fallen −1.42% in the past 24 hours. Track more dynamics on USL price chart.
USL net asset value is 36.17 today — it's risen 2.71% over the past month. NAV represents the total value of the fund's assets less liabilities and serves as a gauge of the fund's performance.
USL assets under management is 43.86 M USD. AUM is an important metric as it reflects the fund's size and can serve as a gauge of how successful the fund is in attracting investors, which, in its turn, can influence decision-making.
USL price has risen by 2.82% over the last month, and its yearly performance shows a −6.96% decrease. See more dynamics on USL price chart.
NAV returns, another gauge of an ETF dynamics, showed a 5.44% increase in three-month performance and has decreased by −7.46% in a year.
NAV returns, another gauge of an ETF dynamics, showed a 5.44% increase in three-month performance and has decreased by −7.46% in a year.
USL fund flows account for −12.84 M USD (1 year). Many traders use this metric to get insight into investors' sentiment and evaluate whether it's time to buy or sell the fund.
Since ETFs work like an individual stock, they can be bought and sold on exchanges (e.g. NASDAQ, NYSE, EURONEXT). As it happens with stocks, you need to select a brokerage to access trading. Explore our list of available brokers to find the one to help execute your strategies. Don't forget to do your research before getting to trading. Explore ETFs metrics in our ETF screener to find a reliable opportunity.
USL invests in cash. See more details in our Analysis section.
USL expense ratio is 0.85%. It's an important metric for helping traders understand the fund's operating costs relative to assets and how expensive it would be to hold the fund.
No, USL isn't leveraged, meaning it doesn't use borrowings or financial derivatives to magnify the performance of the underlying assets or index it follows.
In some ways, ETFs are safe investments, but in a broader sense, they're not safer than any other asset, so it's crucial to analyze a fund before investing. But if your research gives a vague answer, you can always refer to technical analysis.
Today, USL technical analysis shows the sell rating and its 1-week rating is neutral. Since market conditions are prone to changes, it's worth looking a bit further into the future — according to the 1-month rating USL shows the buy signal. See more of USL technicals for a more comprehensive analysis.
Today, USL technical analysis shows the sell rating and its 1-week rating is neutral. Since market conditions are prone to changes, it's worth looking a bit further into the future — according to the 1-month rating USL shows the buy signal. See more of USL technicals for a more comprehensive analysis.
No, USL doesn't pay dividends to its holders.
USL trades at a premium (0.17%).
Premium/discount to NAV expresses the difference between the ETF’s price and its NAV value. A positive percentage indicates a premium, meaning the ETF trades at a higher price than the calculated NAV. Conversely, a negative percentage indicates a discount, suggesting the ETF trades at a lower price than NAV.
Premium/discount to NAV expresses the difference between the ETF’s price and its NAV value. A positive percentage indicates a premium, meaning the ETF trades at a higher price than the calculated NAV. Conversely, a negative percentage indicates a discount, suggesting the ETF trades at a lower price than NAV.
USL shares are issued by The Marygold Cos, Inc.
USL follows the 12 Month Light Sweet Crude Oil. ETFs usually track some benchmark seeking to replicate its performance and guide asset selection and objectives.
The fund started trading on Dec 6, 2007.
The fund's management style is passive, meaning it's aiming to replicate the performance of the underlying index by holding assets in the same proportions as the index. The goal is to match the index's returns.