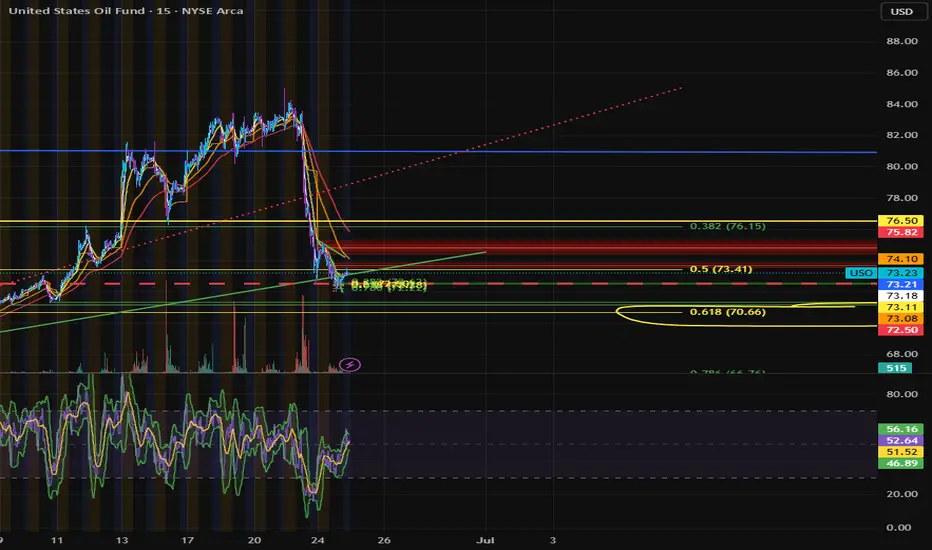
$USO Calls entered 6/24With our current geopolitical standing, the degree of the drop the 23rd-24th of June, and the direction. analysis of the SPX, I believe we have been presented with a very fruitful opportunity. We've seen a NASTY dip after what seems to be a 5 wave move up.
After drawing fib retracements, we closed the market with a small dip under the .5 retracement level. its HERE i added.
Should The indexes react to their potential "Abandoned Baby" setups, Oil should rebound.
USO trade ideas
Major Resistance Test for OilUSO trying to break above the $83 area for the fifth time since 2023 here. If it can manage to do so I'd be expecting a much bigger move. Potentially all the way up to the trendline above or the high from 2022 around $93.
Ideal long entry would be on a break and retest of $83, or just longing on the break since it could be a while before it retests. Just have to be careful for a potential fake out which could lead to yet another big rejection.

$USO to $29-42 before a bottom is inAMEX:USO broke down from a long term that started in March 2020 and is now breaking down below support at $67.
The most likely outcome is a continuation down to the lower support levels at $29-33.
I won't rule out the possibility of one more retest of the trend line ($73-75) before continuing down further. An invalidation of the short would be a break over the $83 level.
Otherwise, downside is the most likely outcome from here.
Let's see how it plays out over the coming months.

USO Stock Chart Fibonacci Analysis 060225Trading Idea
1) Find a FIBO slingshot
2) Check FIBO 61.80% level
3) Entry Point > 67.8/61.80%
Chart time frame:B
A) 15 min(1W-3M)
B) 1 hr(3M-6M)
C) 4 hr(6M-1year)
D) 1 day(1-3years)
Stock progress:A
A) Keep rising over 61.80% resistance
B) 61.80% resistance
C) 61.80% support
D) Hit the bottom
E) Hit the top
Stocks rise as they rise from support and fall from resistance. Our goal is to find a low support point and enter. It can be referred to as buying at the pullback point. The pullback point can be found with a Fibonacci extension of 61.80%. This is a step to find entry level. 1) Find a triangle (Fibonacci Speed Fan Line) that connects the high (resistance) and low (support) points of the stock in progress, where it is continuously expressed as a Slingshot, 2) and create a Fibonacci extension level for the first rising wave from the start point of slingshot pattern.
When the current price goes over 61.80% level , that can be a good entry point, especially if the SMA 100 and 200 curves are gathered together at 61.80%, it is a very good entry point.
As a great help, tradingview provides these Fibonacci speed fan lines and extension levels with ease. So if you use the Fibonacci fan line, the extension level, and the SMA 100/200 curve well, you can find an entry point for the stock market. At least you have to enter at this low point to avoid trading failure, and if you are skilled at entering this low point, with fibonacci6180 technique, your reading skill to chart will be greatly improved.
If you want to do day trading, please set the time frame to 5 minutes or 15 minutes, and you will see many of the low point of rising stocks.
If want to prefer long term range trading, you can set the time frame to 1 hr or 1 day.

USO long tgt $81I do dowsing & had a date to watch for on Monday 5/5 in USO from a reading I did on 3/25 & it even suggested a swing low! Yay! I don't always get the correct info going into these dates, so I'm hoping this will get more consistent.
Anyway, there may be a spike down in USO in the near future. If so, it's a buying opportunity as my work suggests this is a longer term low that's in place. I get a target of $81, but it also did give me 84, but that's the prior high & suspect. That's why I asked a second time & got 81.
When I ask what date we may hit this target by, I get the date of July 17th, so watch what happens there.
That's all for now!

US oil roadmap (rough)When it touches the blue lower rail I will buy GTE on the basis the USO ETF looks bullish
Short term bearish af
Long term bullish
Not financial advice

Opening (IRA): USO May 16th -75C/October 17th 45C LCD*... for a 26.25 debit.
Comments: Buying the back month 90 delta and selling the front month strike that pays for all of the extrinsic in the long. (The long call is shown at a higher strike so that it fits on the chart).
Metrics:
Buying Power Effect: 26.25
Break Even: 71.25
Max Profit: 3.75
ROC at Max: 14.3%
50% Max: 1.88
ROC at 50%: 7.2%
Will generally look to take profit at 50% max and/or roll out short call at 50% max to reduce down side break even.
* -- Long call diagonal.

Downside tgt hit on USO. Bounce to $70?I've seen so many targets hit and reverse - especially GLD & GDXJ- I figured I may as well see if USO has a similar reversal since the downside target from my last USO idea is tagged & holding.
At the moment I get that it can get back up to the $70-71 area & it's a bull trap.
I also get the date of the 16th, so there's often reversals or interesting price action around dates. Oh, I do dowsing, btw, and that's where all my levels and information comes from. We'll see.

USO swing high- short tgt 65-66I asked my dowsing for the next trade to help reach my goal for the year, and it's oil/ USO. I do believe this will include oil stocks, so I may ask for dowsing to choose one from a list. If I do & get the reading done on it, I'll post it as another idea.
My latest work is pretty decent, but a work in progress. I'm really trying to determine time frames for when targets will hit so we can get the right options & mental expectation (i.e. patience) for things to develop.
The target is 65. In my mind I got 63, but I'm only sharing that because I'm also testing my own intuition more lately. The date we hit by is around April 28th.
I also have been guided to get dates from the past as an indication of what to expect, & the date given was 1/21, which was a gap down. I suspect there will be a gap down tomorrow, or at least the move down starts more aggressively. This has worked in prior ideas on TSLA & I think SPY... but can't remember.
I really am enjoying this method so far as my levels are often hit & I can just relax & allow things to happen with more faith they will. Of course, there's always the chance it's completely wrong & it is a smaller move, but we'll see.

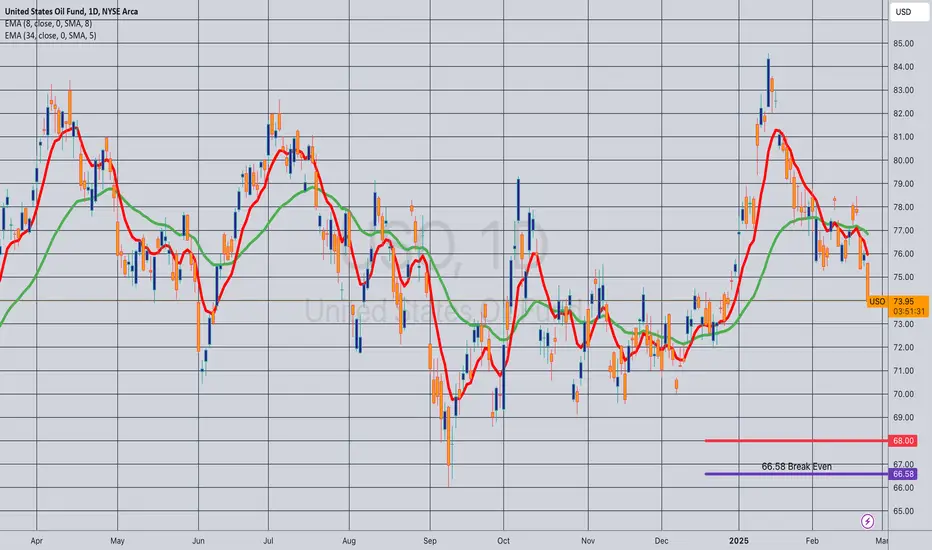
Opening (IRA): USO April 17th 68 Covered Call... for a 66.58 debit.
Comments: With /CL dropping sub-70/bbl., putting on a starter position in USO, selling the -75 delta call against shares to emulate the delta metrics of a 25 delta short put, but with the built-in defense of the short call.
Metrics:
Buying Power Effect/Break Even: 66.58/share
Max Profit: 1.42
ROC at Max: 2.13%
50% Max: .71
ROC at 50% Max: 1.07%
Will generally look to take profit at 50% max, add at intervals if I can get in at strikes/break evens better than what I currently have on, and/or roll out short call if my take profit is not hit.
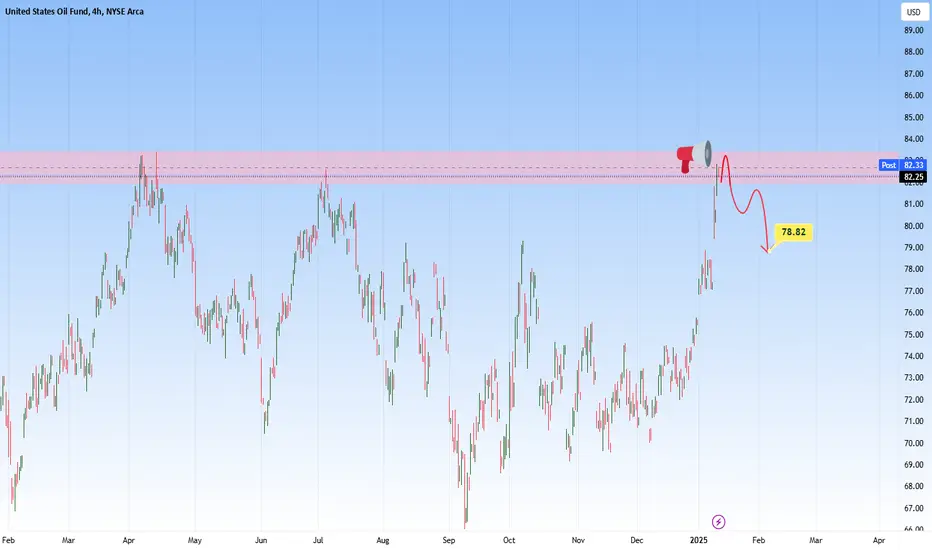
USO Bearish Outlook: Sell Opportunity as Momentum Shifts Current Resistance Zone: The price is currently testing a strong resistance zone around the $83 level. in the past, this level has been a turning point for price movements.
Potential Reversal: The chart suggests a possible rejection from the resistance zone, with a projected short-term correction to approximately $78.82 .
Key Levels:
-Resistance: $82.75–$83.25.
-Support: $78.82 (highlighted as target).
Scenario: After testing the resistance zone, a pullback towards $78.82 is expected, aligning with previous price behavior. A confirmed break above $83 would invalidate this bearish outlook.
Note: Always combine technical levels with broader market context and risk management.
Opening (IRA): USO February 21st 79/April 17th 107 PMCP** -- Poor Man's Covered Put
Comments: Shorting USO on strength using a long put diagonal/Poor Man's Covered Put, buying the back month 90 delta put and selling the front month 30 that pays for all of the extrinsic in the long.
Metrics:
Buying Power Effect: 22.96 debit
Break Even: 84.04
Max Profit: 5.04
ROC at Max: 21.95%
50% Max: 2.52
ROC at 50% Max: 10.98%
Will generally look to take profit at 50% max, roll out the short put on approaching worthless.

USO Climbs to Resistance! Can Bulls Maintain Momentum?Technical Analysis Overview:
1-Hour Chart:
* Trend: USO is in a strong uptrend, reaching $84.36 near the upper trendline.
* Indicators:
* MACD: Positive momentum, with the MACD line above the signal line.
* Stochastic RSI: Overbought at 92.16, suggesting a potential pullback or consolidation.
30-Minute Chart:
* Price Action:
* USO is trading near resistance at $84.50, with support around $82.80.
* Increasing volume supports the recent bullish move.
Key Levels to Watch:
Support Levels:
* $82.80: Immediate support zone.
* $78.89: Strong support level.
* $77.05: Key support from prior consolidation.
Resistance Levels:
* $84.50: Immediate resistance at the upper trendline.
* $86: Next resistance level if $84.50 is breached.
Trade Scenarios:
Bullish Scenario:
* Entry: Break above $84.50 with volume confirmation.
* Target: $86-$88.
* Stop-Loss: Below $82.80 to limit risk.
Bearish Scenario:
* Entry: Rejection at $84.50 or breakdown below $82.80.
* Target: $80-$78.89.
* Stop-Loss: Above $84.50 to minimize losses.
Directional Bias:
* USO’s upward momentum suggests bullish strength, but the overbought Stochastic RSI warns of potential consolidation or a pullback near $84.50 resistance.
Conclusion:
USO is trading near critical resistance at $84.50. A breakout could propel prices toward $86, while failure to hold current levels may lead to a retest of support at $82.80 or lower. Monitor volume and momentum indicators for actionable setups.
Disclaimer:
This analysis is for educational purposes only and does not constitute financial advice. Always conduct your research and trade responsibly.

USO to fall, Buying SCOMy trading plan is very simple.
I buy or sell when price tags the top or bottom of parallel channels.
I confirm when price hits Fibonacci levels.
So...
Here's why I'm picking this symbol to do the thing.
Price above or at top of channels (period 100 52 39 & 26)
Stochastic Momentum Index (SMI) at overbought level
VBSM is spiked positive and at top of Bollinger Band
Buying AMEX:SCO at $16.30. Target $18.
Shorting AMEX:USO at $77.08. Target $73.

Opening (IRA): USO January 17th 68 Covered Call... for a 66.72 break even.
Comments: Dinking and doinking on USO at /CL <$70/bbl.
Metrics:
Buying Power Effect/Break Even: 66.72
Max Profit: 1.38
ROC at Max: 2.07%
50% Max: .69
ROC at 50% Max: 1.04%
Will generally look to take profit at 50% max; add if I can get in at better break evens/strike prices.

Opening (IRA): USO Jan 17th 66 Covered Call... for a 64.89 break even.
Comments: With 42 DTE in the January monthly, adding a "rung" to my USO position at strikes better than what I currently have on at the 68, selling the -75 delta call against stock to emulate the delta metrics of a 25 delta short put, but with the built-in defense of the short call. The ROC at max isn't stellar here with the usual metric I'm looking for being at least 2.0%.
Metrics:
Buying Power Effect/Break Even: 64.89/share
Max Profit: 1.11
ROC at Max: 1.71%
50% Max: .56
ROC at 50% Max: .86%
Will generally look to take profit at 50% max, roll out the short call on test of my take profit at 65.45.

Opening (IRA): USO December 20th 68 Covered Call... for a 66.48 debit.
Comments: Back into the slippery stuff with /CL trading at 70.48. Selling the -75 delta call against stock to emulate the delta metrics of a 25 delta short put, but with the built-in defense of the short call.
My basic approach here is to dink and donk on the underlying when /CL is at $70/bbl. or below.
Metrics:
Break Even/Buying Power Effect: 66.48
Max Profit: 1.52
ROC at Max: 2.29%
50% Max: .76
ROC at 50% Max: 1.15%
Will generally look to take profit at 50% max; roll out short call on take profit test. I'll also look to add "rungs" should I be able to do so at strikes/break evens better than what I currently have on.

Opening (IRA): USO December 20th 66 Covered Call... for a 64.74 debit.
Comments: Adding at strikes/break evens than what I currently have on ... . Selling the -75 call against long stock to emulate the delta metrics of a 25 delta short put, but with the built-in defense of the short call.
Metrics:
Buying Power Effect/Break Even: 64.74
Max Profit: 1.26
ROC at Max: 1.95%
50% Max: .63
ROC at 50% Max: .97%
Will generally look to take profit at 50% max; roll out call on test.

Opening (IRA): USO Oct 18th 69 Monied Covered Call... for a 67.44 debit.
Comments: This isn't as low as I wanted to get in, but the short call is below where I would've entered would have to have been more patient and waited for 70. In any event, selling the -75 delta call against shares to emulate the delta metrics of a 25 delta short put, but with the built-in defense of the short call.
Metrics:
Buying Power Effect/Break Even: 67.44/share
Max Profit: 1.56 ($156)
ROC at Max: 2.31%
ROC at 50% Max: .78 ($78)
ROC at 50% Max: 1.16%
Take profit at 50% max; roll in-profit short call to maintain net delta <30.

Opened (IRA): USO Dec 20th 63 Covered Call... for a 61.26 debit.
Comments: (Late Post). High IV (67.7% as of Tuesday close) + weakness.
Added a "rung" to my existing position at a strike better than what I currently have on, selling the -75 delta call against shares to emulate the delta metrics of a 25 delta short put, but with the built-in defense of the short call.
Metrics:
Buying Power Effect/Break Even: 61.26
Max Profit: 1.74
ROC at Max: 2.84%
50% Max: .87
ROC at 50% Max: 1.42%
Will generally look to take profit at 50% max, roll out in-profit short call on test of take profit. Here, the 50% max take profit would be .87 + 61.26 or 62.13.

Opening (IRA): USO December 20th 65 Covered Call... for a 62.41 break even.
Comments: High IVR/IV (79/51) plus weakness. Adding a rung to my USO position out in December at break evens better than what I currently have on. Selling the -75 delta call against stock to emulate the delta metrics of a 25 delta short put, but with the built-in defense of the short call.
Metrics:
Buying Power Effect/Break Even: 62.41
Max Profit: 2.59
ROC at Max: 4.15%
50% Max: 1.30
ROC at 50% Max: 2.07%
Will generally look to take profit at 50% max; look to roll out the short call on test.

Opening (IRA): USO Nov 15th 67 Covered Call... for a 65.26 debit.
Comments: Adding a rung at strike prices better than what I currently have on, selling the -75 delta call against long stock to emulate the delta metrics of a 25 delta short put, but with built-in short call defense.
Metrics:
Buying Power Effect/Break Even: 65.26
Max Profit: 1.74 ($174)
ROC at Max: 2.67%
50% Max: .87
ROC at 50% Max: 1.33%
Will generally look to take profit at 50% max/roll out the short call on side test.

Short crude oil, and oil fundoil has found itself at some good resistance levels.
I believe the pros will shake the market out and we go lower.
and only then WITH war oil will rally very high.
see my alternative on the chart
