USO setting up for a short or putTechnical show USO is moving lower. My plan is to short at current value with a Target 1 at 13.65.
I am using puts as follows. USO 17 Aug Put. My strike was at .15 per put.
Price is already up 20% on the day.
USO trade ideas

THE WEEK AHEAD: USO, XOP, XLE DOWNWARD PUT DIAGONALSWhile I'm waiting for my August monthly premium selling plays to grind out, I'm pounding the pavement for potential directional plays to get in on. Late last week, I shorted TLT at the 122 horizontal resistance level I alerted last week via the inverse TBT, (See TBT Upward Call Diagonal Post Below), so I'm looking for fun in other places, one of which is in USO, XOP, or XLE (pick your poison).
Granted, USO is pesky and hard to work with due to its size. Nevertheless, it's a good small underlying that small accounts can potentially work without it causing too much pain in the event things don't go your way.
This week, I'm eyeing the resistance level at 16 for a long-dated bearish assumption setup. Naturally, you can do a risk one to make one, static one-off spread to play it (i.e., a short call vertical or a long put vertical wrapped around 16 if we hit that level), but I generally opt for setup flexibility in the event I feel I need more time for the play to work out and/or to reduce cost basis, and my go-to setup for that is a diagonal. Pictured here is an Oct/Jan 14/19 downward put diagonal, with the following metrics:
Max Loss on Setup: $370/contract
Max Profit on Setup: $130/contract
Break Even on Setup: 15.30 vs. 15.06 spot
Debit Paid/Spread Width Ratio: 74%
Take Profit: 20% of debit paid or $74
Naturally, if USO gets to 16, some adjustment to the setup will be required, so this is just an example of the setup I would use (i.e., (1) setup break even at or above spot; (2) debit paid/spread width ratio of <75%). The other thing to note is that I'm not particularly fond of going out to October for the front month. Currently, however, no Sept expiry is available and the Aug 17th 14 short put strike is paying a paltry .20. Consequently, I can potentially see (a) just buying the ~90 delta long put back month if we hit 16 and then subsequently legging into the short put aspect on a meaningful drop; or (b) buying an Aug/Jan setup in spite of the paltry .20 received for the 14 short and then rolling the short out in time to bring in more credit if we get a drop in price such that the 14 strike brings in a significant credit (I generally opt for the latter; some cover is better than no cover at all, even if it is a lousy $20)).
Natural alternatives would be a similar setup in XOP on a hit of overhead horizontal resistance at 44.50-45.00. There, however, I'd probably go with my standard "skip month" diagonal: preliminarily, the Aug/Oct 41/48 costs 4.84/contract to put on, has a nice 2.16 max profit on setup, a break even of 43.16 versus 43.06 spot, a debit paid/spread width ratio of 69.1%, and a 20% take profit of $97/contract.
Similarly, XLE overhead resistance is between 79 and 80: preliminarily, the Aug/Dec (no October monthly available) 73/86 costs 9.86/contract to put on, has a max profit on setup of 3.14, a break even of 76.14 versus 75.94 spot, a debit paid/spread width ratio of 75.8%, and a 20% take profit of $198/contract. That 75.8% metric is a bit more than I'd like to pay, but the trade off is having more roll opportunities to reduce cost basis and improve my break even.
OTHER PENDING ALERTS:
IWM SHORT, DOWNWARD PUT DIAGONAL/POOR MAN'S COVERED PUT AT ~170 or QQQ SHORT, DOWNWARD PUT DIAGONAL/POOR MAN'S COVERED PUT AT ~177 (PRIMARILY TO ADD SHORT DELTA TO COVERED CALL PORTFOLIO).
GLD BULLISH ASSUMPTION SETUP AT ~115 OR GDX BULLISH ASSUMPTION SETUP AT ~21.

OilOil price up today (70.64)
USO (14.27) maybe a buy these next few days? If Cup pattern is correct..
Entry at 14.84

USO plaing with support lineBefore the trade
there will be a bouce st that level and price will go up to the 15 level
because the price is in the support lever
After the trade
You recongnize teh resistance levele and act accordingly
Trying and trying maybe you should play wiht stop limit orders

USO @ critical junctureUSO, retested uptrend line and failed big on Friday. Now, it is at its recent bottom around 13. If it does not hold here, there is a chance for a gap fill. USO has not rebounded well since the increased production announcement from Middle East and Russia. Some of the energy names are falling. SLB for example has a huge head and shoulders. It is a pattern to watch. Recent head and shoulders has not worked that well in the market.

USO oil fund shortBreak and backtest from underside of long term uptrend suggests possible fall away lower now in a wave iii/c for at least 10% lower

Gaps to catch on the downsideUSO fund left some gap on the way up from 9$ levels... need to fill those .... Selling advised fr downside tgts...


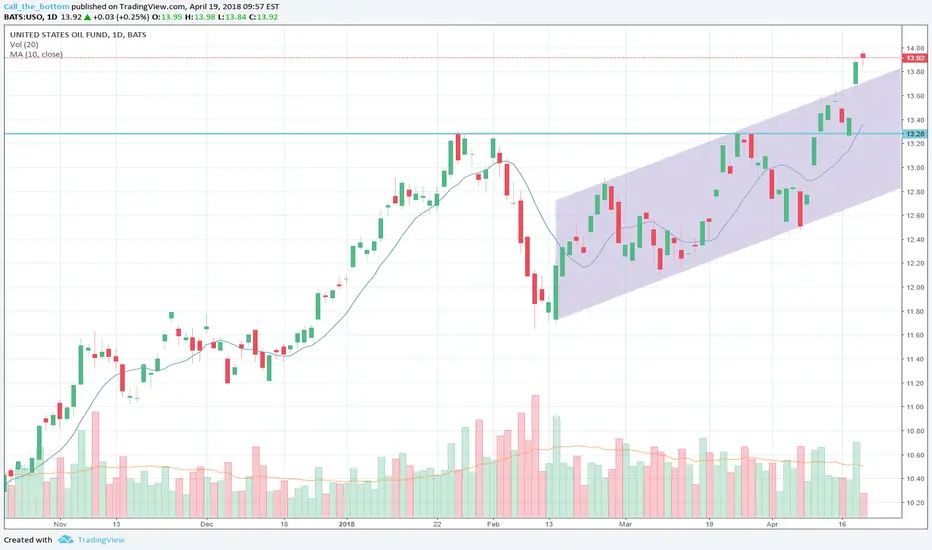
USO finding support soon?uso breaking through its first bullish trendline, next support zone could be around 12.5 - 12.75.

Decision Time for USOWe are at the bottom of the channel, looking for some bounce here. Also having consecutive new highs while in the channel, further signaling the trend continuation.


OPENING: USO JULY/OCT 10/13/13/16 DOUBLE DIAGONAL... for a .77/contract credit.
Truth be told, I kind of hate USO, with XOP being my go-to for petro-based plays. That being said, with its high implied volatility rank (65) and its decent background volatility (31%), I figured I'd throw a "can't hurt much" trade on here as a demo trade for a "safety tape" setup.
The basic notion of a "safety tape" trade is to define your risk with longer-dated, cheap throwaway longs, while trading essentially naked inside the longs. This is particularly useful in cash secured/small account environments where being naked invokes a buying power reduction equal to the short put strike minus the credit received and/or where brokers generally prohibit naked short calls, with the workaround being to buy a cheap long call anyway to define the theoretically infinite risk that a naked short call entails. Alternatively, it's a way for people who fear the notion of full on naked from a risk standpoint to get some of the benefits that trading naked entails (i.e., fewer legs, quicker vol crush and/or theta decay, easier rolls) without "hanging all their junk out there." (No one wants to see that).
Here, the buying power effect is attributable to the widest wing of the setup (3.00), minus the credit received (.77) or 2.23, far less than you'd tie up trading the naked short straddle cash secured (basically, $1200, since the July 20th 13 short straddle is trading for about a 1.00 here).
I'll look to take profit on the short straddle at 25% max as I would if I were just trading it purely naked, and then sell another ATM short straddle, reusing the longs as many times as I can before they expire ... .

USO short term long callOil ETFs saw a sharp sell-off last week over concerns regarding Russia and Saudi Arabia. Given the support levels of the channel we have been trading in, I would like to see a bounce to the upside in the near future. Upcoming OPEC meeting on June 22 is a cause for caution in the energy sector, making volatility likely.

USO failedWrite sometning about your psyhology thinking before trade? It is suterday and I am relaxed so see no problem, I just fell my back again
Describe the trade. What you see? There will be a sell off in the USO what suggest the technical patterns and two supportd at 12.45 and bent, the problem could be only a contango.
Write why you want to enter the trade in this point? it is ideal point befor two support levels

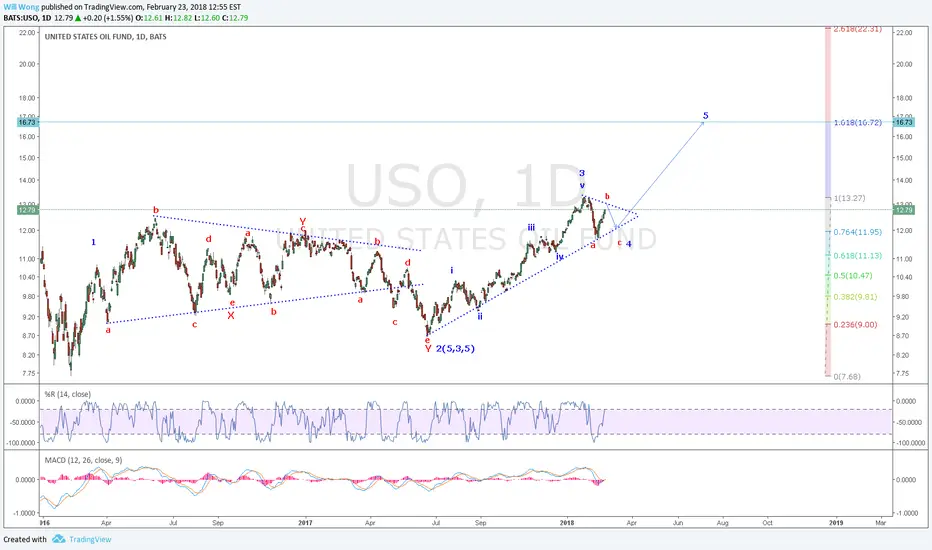
USO topping?
If making A-B-C, Oil may have topped or topping very soon. Then the target is eventually making a new low with crude possibly going down to 25 area.
If making the larger degree iii, blue box area makes sense. Then the target area will be as marked.
Personally, I am leaning toward blue box area. Either way, I am beginning to short the energy complex this coming week.

USO LongUSO technicals showed a triangular consolidation which lead to positive continuation on the daily chart which is resulting in a continued reversal on the weekly chart from the previous downtrend. Trump helped oil by withdrawing from the Iran deal so this catalyst coupled with the technical charting should provide a fairly strong up trend.
USO broke out of the triangle upwards, revisited the average, and is now pushing upward in a strong manner leading to a close outside the daily band resulting in increased volatility.


$USO $QQQ $SPY Oil Driving Markets Up Further Here [short-term]Meant for intra-day purposes.
Oil is clearly propping markets. It seems to have bottomed for the time being. Bullish for a short-term play.

Oil two bullish confirmationsAMEX:USO MIL:CRUD AMEX:UCO AMEX:XLE
1) It has crossed the horizontal resistance
2) It has left the parallel chanel depicted below
USO - ShortSlight RSI & MACD divergence.
Small position to catch the down move to 50 MA and longer term TL support.
AMEX:USO


