USO Fibonacci Levels Support & ResistanceWTI Crude, and USO by extension, continue to hit and bounce and break through three key sets of Fibonacci projections/extensions. Overall sentiment is bearish. I Included the Fisher Transform, Vortex Indicator, and the Ultimate Oscillator as other relevant predictors of price action. I believe WTI and Brent are headed much lower, even to a 'one-day-only' $15 print in WTI.
USO trade ideas

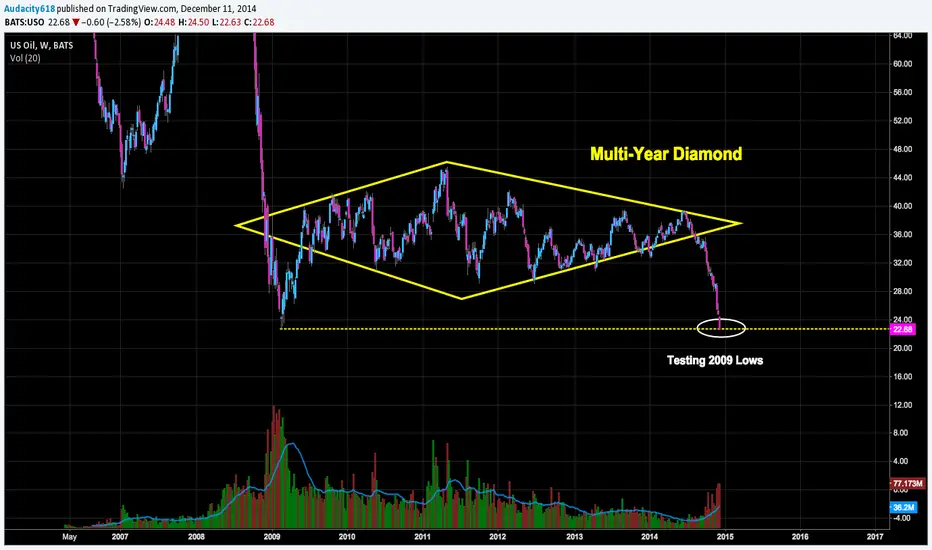
Testing 2009 LowsInteresting price levels for USO which actually closed a few cents lower than 2009 lows. Continuation or a bounce? Looking for confirmation in either trade opportunity.
US oil observationAlthough i really try not to indulge myself in trades i deem biased - OIL that is manipulated to affect Russia IMHO. This was interesting to see.
- I had the blue trend lines plotted for quite some time already
- Drawing parallels from the tops showed also some relative hit ration with the price trending around them
- CCI ran away from RSI and already is diverging
- Of course, all bottom indicating indicators are ...indicating bottoms.
- With high volume in recent days, if a bottom is formed it may retrace to some important fib level,like 0.382 or 0.5 that sit nicely within some trend range
- theres also a gap there that hasnt been filled
Won't say im long,but i wont be shorting too much at this point either

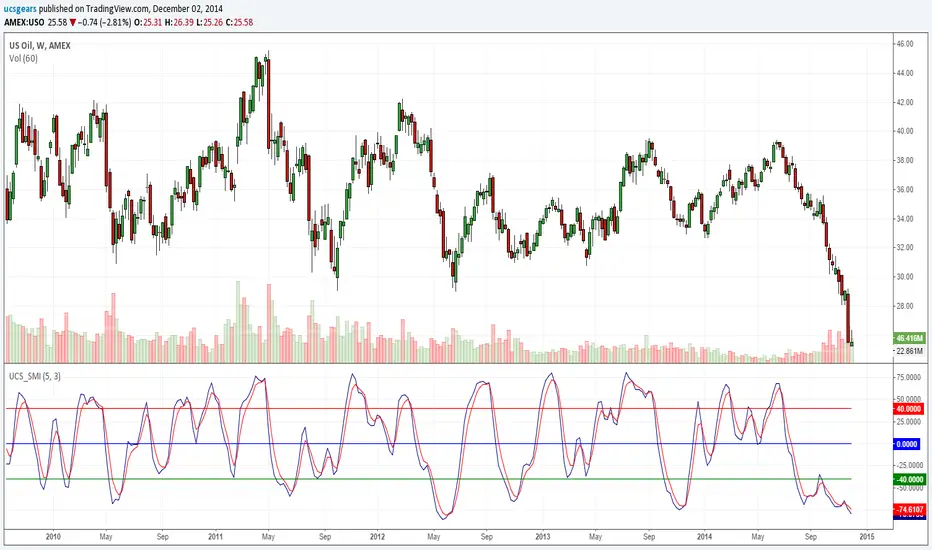

US Oil ETF Poised for Bearish Break Out on Lower Oil Prices USO has sky dived from $120 (off the chart), on July 2008, to as low as $23 in Feb 2009, signaling a very clear bearish trend.
However from July 2009 until now, price has been consolidating sideways between $42 and $30, from July 2009 to June 2012. Subsequently, the sideways range narrowed to $39.40 and $30, from June 2012 up till now. All in all this sideways consolidation is has been going on for about 63 months now.
This is roughly a sideways Rectangle chart pattern, which is a pause in the bearish trend in , with a view to trade at lower prices.
We observed that the latest price action, starting from 2014-06-25, is a developing Elliott 5 Wave pattern, with the price poised to break out on the down side to complete the fifth wave.
Therefore we project that a bearish breakout is likely to occur, should price trades below $30.55 over the next few trading days.
Break Out Condition:
When price trades below 30.55.
Stop Loss:
Above 31.55
Taking Profit:
Take Profit Target will be around $27.20, based on the low of 2009-04-20.
Risk:
There is always a risk that this a false break out, with possible support buying around $30.00.
References:
Rectangle Chart Pattern> www.babypips.com
Elliott Wave> www.elliottwave.com
P.S. Sorry friends, I have not been writing new Ideas for a while, as I was working on my CMT Level 3 Exam.
Like it, Share it, Follow it~
Trading View: BreakOutArtist
StockTwits: stocktwits.com/BreakOutArtist
Twitter: twitter.com/BrkOutArtist
Facebook: www.facebook.com
TradeHero: BreakOutArtist

USO- Nice Little Double Bottom? Support at the least10-30 Nice little double bottom here that MAY be in the works.
Support zone at the least. Notice the standard AFTER the retest
of the lows how when it thus far launched it broke the downtrend
(green) to the upside? That is exactly what one wants to see.
For educational and informational purposes only
Trade at your own risk, These are not recommendations.

USO AT PAST LEVELS OF SUPPORT USO is at past levels of support based on long term Weekly timeframe and seems to be wavering on hourly chart.


Simple Reason Why Oil Will Bounce Here: Duh! (USO)Oil is taking a beating again today. While many bears are talking about oil going much lower in the next few weeks, it has likely bottomed. Why? Simply put, Russia and the middle east (Iran) will start some trouble to boost the price. Remember, 90% of their economies depend on oil. Just watch, something crazy will happen in the next 48 hours to stabilize and bounce oil in the near term.
Gareth Soloway
Chief Market Strategist
www.InTheMoneyStocks.com

US Oil Short From Bullish Flag; High Risk:Reward RatioUSO has broken it's uptrend a few weeks back, and since has been heading violently lower with no signs of stopping, at least not yet. Not in my eyes. I had a plethora of converging indications, so I've marked them in the chart A - F, and then explained my trade setup. Good luck.
A) RSI has broken above the 35 level, but this is likely because it bounced a bit from being oversold. It remains below 50 which is a bearish indication and still has resistance at the 40 level.
B) The cream of the crop. B marks the head of a head and shoulders pattern in USO. You can see when the neckline was broken here, while simultaneously breaking a series of important EMAs, USO began it's slide. We would expect some sort of throw back to this neckline. This will be important in our trade setup later.
C) Here is our bearish flag and Andrew's Pitchfork. You can see the slight countertrend movement off the lower bollinger band, and what now looks to be a hanging man. This entire move up is hitting resistance in the pitch fork, as well as the flag formation, and has formed entirely on declining volume. That's not a positive sign for continued upward momentum.
D) PSZ (Prior Support Zone) from way back when. I'm expecting a move down into this zone where it will coincide with support at the lower BB or lower median pitchfork line. We may get a bounce down here, or more consolidation.
E) Volume Decline Throughout Bear Flag
F) Declining & Still Negative MACD
The one thing I didn't like here was the RSI, and that the weekly chart shows that we may need a throwback before extended downward momentum. This is where that neckline comes into play. We may very well see a throwback to the 66 area before we are awarded with any serious downside momentum. However the weekly RSI is also in a downtrend, reinforcing our bearish outlook. I'm short a directional diagonal on this play, to take advantage of Theta decay, and let oil slowly drift lower in my favor until we reach that prior support and I debate what the next play will be. More downside, or a retracement? Maybe a renewed uptrend? Who knows?


$USO may have found support 08-15-2014The bullish harami at support may be the beginning of a reversal. Tension in Ukraine will help crude oil go higher. The broader momentum is still negative but a bounce may come here.

Beware Of This Scary Pattern: $USOAs the overall markets fall sharply today, the United States Oil Fund LP (ETF) (NYSEARCA:USO) which is a popular ETF that tracks the price of oil has put an extremely bearish pattern in place.
Today, the United States Oil Fund LP (ETF) (NYSEARCA:USO) gapped down below a major trend line, triggering a Head and Shoulders top around the $36.92 level. This ETF is now trading around $36.40, down close to 1.50% for the day as the sell off intensifies.
The United States Oil Fund LP (ETF) (NYSEARCA:USO) will have some support at the 200 day moving average at $36.13 but the only ultimate target will be $34.40.
To get our live trade alerts like this 10% profit earned in 3 days and more, join us at the Elite Round Table right now!
www.inthemoneystocks.com

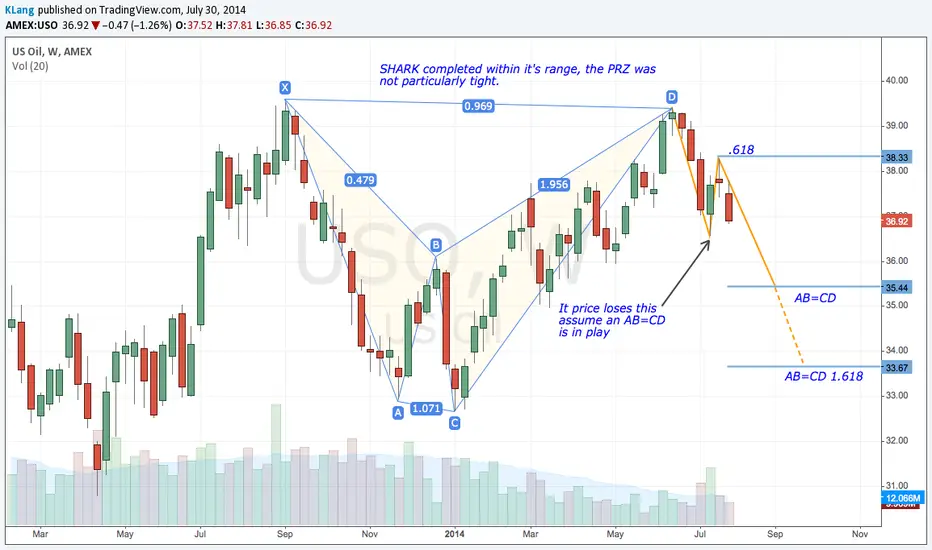
Short Term Bottom in Oil I've noticed the price of gas has been declining for about three to four weeks. Come to see, Oil has been in a free fall for a month now. From the bottom in mid-April to the high in late-June, the 61.8% provided a technical level that prices could bounce off of. Even when the harmonic patterns aren't evident, the harmonic ratios are always close by dictating prices.
The volume increase we saw as prices approached the 61.8% fib, to me, confirm the bottom we've formed. Again, lower prices spur buying, appearing as a bargain for some. With the addition of RSI Divergence, I feel we go up from here but I can't say for how long. My job's to trade what's given to me.
That being said, I'll wait on the sidelines until a buying opportunity presents itself or selling becomes to the new bias, allowing me to act accordingly.

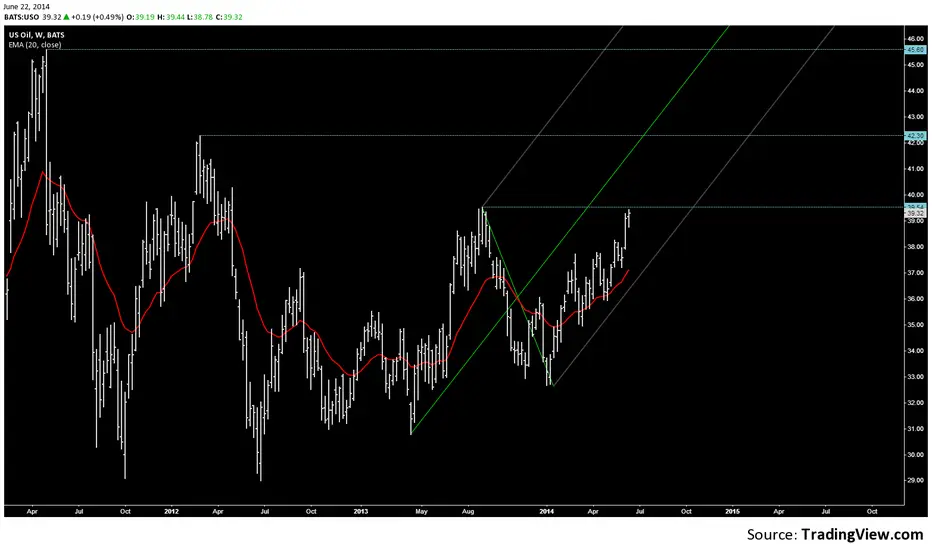
US OIL FUND (weekly)Three resistance levels in front of US Oil fund. I'll buy at each breakout. It was 116.0 before 2008..Oil prices could stay high for a long time due to geopolitical events and increasing demand.
Trading US OIL using RENKOPrinciples
4 bars can set a trend ; MA 20 & 50 as a direction guide
retracement 1,2,3 bars ; or 4 bars if trend greater equal 10 bars
Consider counter trend when RSI came back from oversold /bought area
Entry method
1) enter on retracement (1st bar aggressive) + cross MA
2) enter on SR break + cross MA: SR can be a 1~2 bar range
3) Enter on double bottom / top + cross MA
In chart: Triangles are entry ; arrow / channel are SR

USO=> IRAQ/UKRAINE ENERGY CRISISDue to the issues in the middle east the worlds oil prices are gaining at a rapid pace.
In the event the city of Baghdad falls or the southern territories fall the surge in American Oil will be explosive.
The stock currently is in a out mode based off the upper indicators which I will not get into however the price which will continually rise of 38.853 and better will continually move the price of this company higher.
Yesterdays surge in volume will only be confirmed by today's crisis in Europe and Middle East will probably lead to a higher price for domestic oil due to the fact we import 30% of our oil from Iraq.

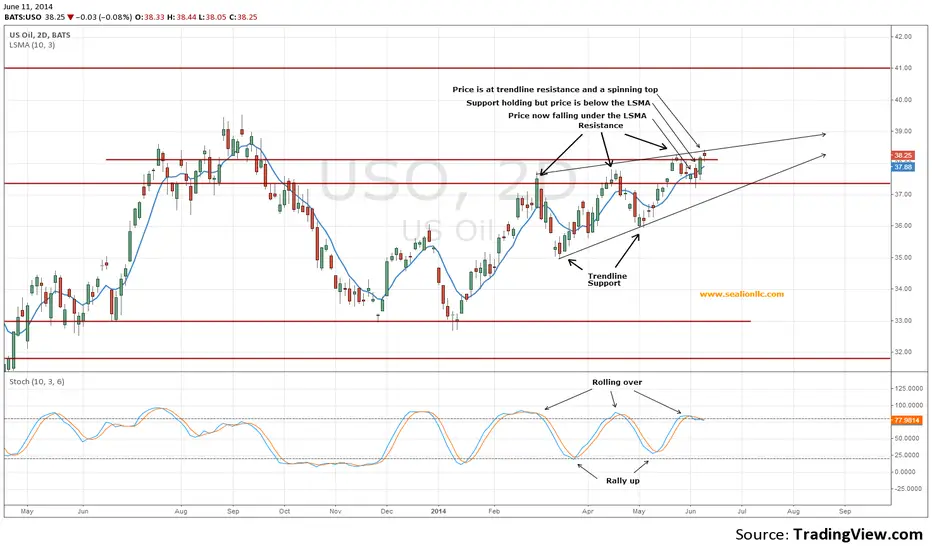
$USO hits trendline resistance setting up a reversal 06-11-2014USO continues to form a rising wedge which will ultimately create a larger selloff. Until the larger pattern forms, price's range will tighten in the pattern which is now poised for a selloff. The combination of the spinning top candlestick and the stochastic rolling over will bring lower prices in the near term but not for long as the distance between the rising trend lines continues to narrow.
$USO approaching multiple points of resistance 06-09-2014USO is rallying in a rising wedge that will eventually setup its selloff. In the short term it is reaching the highs of ~10 days ago and near a rising line of resistance as well as a horizontal line of price resistance. A little more rally may occur but it should be capped under these lines wherein a short term selloff will follow. The stochastic is setup for a selloff now.

$USO selling will be short lived 06-05-2014USO is now below the LSMA and a bearish crossover has occurred but I don't expect to see much of a selloff. Price is likely to dance around the support/resistance line of $37.55 giving the stochastic a chance to reset for prices to move higher. The rising wedge has a lot of room to run and prices will rise to the $38.75 area quickly once this consolidation has completed.

USO weekly options expiry - small net short for institutionsThis week's options expiry suggests institutions will end the week net short about 600 contracts or about 60,000 shares. They had a vested interest (net 1500 contracts) in ensuring price did not move below $36 and I see they have basically done exactly that. Considering seasonality issues, one shouldn't be surprise to see their net short exposure. The question really is, what is their actual cost on that net short exposure (ie. strike - avg. premium collected)? Because of the significance of the $36 level, long ideas worked well today. I was fortunate to play a BoT long but there really wasn't a long Euro close into Options expiry setup to take. Regardless, that bias off the $36 level may evaporate once the expiry event occurs.
If my charts help you, or you use my indicators...
please consider a BTC donation to allow me to
continue my work :
1EBttA56cWsgtsZn83VGiNT8si7inZV5Z5
& follow me on Twitter @CRInvestor
