USO: StairwalkerUSO has planned a tough workout on the stairwalker. After finishing wave iii in turquoise in the upper turquoise zone between $76.92 and $75.60, it should move upwards to complete wave iv in turquoise. Then, USO should drop into the lower turquoise zone between $73.45 and $72.12 to end waves v in turquoise and 1 in green. Following another countermovement into the green zone between $77.71 and $81.57, where wave 2 in green should end, USO should fall below the support at $67.68 and the one at $62.92. There, it should enter the yellow zone between $60.18 and $43.48 to finish waves 3 in green, c in orange and (2) in yellow.
USO trade ideas

United States Oil Fund (USO) in bullish channelThe price has broken out of a long bearish channel (green color), and is now in a bullish channel (cyan color).
Within the long bearish channel, we can see a downward seasonality in the second half, in the months of July and October.
Will the cycle repeat itself in July or October of this year?

United States Oil FundNo clue how I found this chart, however, with looming concerns on various market, political and world disaster fronts - commodities, specifically OIL has been a major topic.
I still have to do some research on what this fund actually represents, however, I know for a fact it is at a key price point technically.
TECHNICALS
Widening downward cone
At diagonal + horizontal resistance
Fundamental factors could flip this level into support
RED trendline is a long term TL that has served as a sort of mean reversion point since the beginning of this fund.
With price now on the right side of this line, this could be bullish when paired with everything else.
BELOW: Long term charts on the WEEKLY and MONTHLY timeframes.
Also something that should be noted - This security is also listed on FTX as a synthetic stock token.
Previous analyses related to OIL linked below.

Got in oil...Another play.. got in oil at 72.10 .. looking for at least the top of the yellow box... I will trail this ....

USO: Bullish PennantThis is a lower conviction play as the one can argue that the pennant did not enter a consolidation and is part of the continued upward trend however, I would argue that since pennants are continuation patterns with representing a "brief" consolidation, magnitude of the entry (into the pattern) should not matter.
But entering from the bottom, we saw some profit taking on the first spike up (that formed the height of the pennant and we will probably see some reloading through out the pattern. In crude oil futures, we saw a lot of profit taking by speculators at the top of this range (as by COT).
I think structurally (fundamentally) crude oil needs another 25% leg up anyway to be fairly priced (assuming conflict remains but doesn't escalate, and producers don't go back online). 1) The short term news of 1 million released daily from the SPR is nothing (versus the 20 million we consume daily). 2) We are also entering spring/summer/fall where oil is more heavily consumed; on top of an end of COVID lock downs (doesn't seem like we will be doing that anymore even in blue states). 3) With high inflation (houses and physical goods) I can see consumer preferences change from stuff to experiences, ie traveling. Even oil is relatively high to its spot price, inflation adjusted its significantly lower than its last peak - there is probably another spike left to go up.
I think the risk-reward is worth it to buy at the bottom of this channel before we continue heading higher to at least PT of ~96. A position is merited here to be added on the upward breakout if supported by a strong volume bar. I think the downside argument could be made that instead of a pennant this is a longer-term (beginning of) distribution pattern, evident by a selling climax. However, if that's the case USO will have some support by the current positive carry of crude oil giving some positive return (or cushion to ~3-4% monthly) while consolidating in the range. If discovered there is a longer term distribution pattern on the way - I can probably exit at flat.

United States Oil Fund (USA: $USO) Is Still Mega-Bullish! 🔥The United States Oil Fund® LP (USO) is an exchange-traded security whose shares may be purchased and sold on the NYSE Arca. USO’s investment objective is for the daily changes, in percentage terms, of its shares’ net asset value (NAV) to reflect the daily changes, in percentage terms, of the spot price of light sweet crude oil delivered to Cushing, Oklahoma, as measured by the daily changes in the Benchmark Oil Futures Contract. Specifically, USO seeks for the average daily percentage change in USO’s net asset value, for any period of 30 successive valuation days, to be within plus/minus 10% of the average daily percentage change in the price of the Benchmark Oil Futures Contract over the same period.

USO: Island Hopping 🏝 Summer is approaching slowly but surely, and some might start to arrange their next holiday. Meanwhile, USO is already heading south and has a bit of island hopping planned. The first stop should be in the green zone between $68.62 and $66.43, where USO should finish wave 3 in green – and maybe drink a cocktail or two. Then, it should draw some breath in a short countermovement to complete wave 4 in green. Afterwards, the next green island between $62.86 and $60.67 is waiting, where USO should conclude wave 5 in green, wave c in orange and wave in magenta. Following another countermovement in wave in magenta, USO should finally reach the warm beach strip between $60.18 and $43.48 to finish wave in magenta and wave (2) in yellow and to catch some rays.

seems like a temporary top is in for USO, back to the ditches? USO making lower highs, continues to get rejected off many trend resistance zones, big increase in selling volume recently!
im very bearish on this one, my targets are 72.71-67.82-62.94

USOAMEX:USO
I am keeping a very close eye to oil. I am eager to find top. I don't think oil will run forever.

Oil ETF Makes a Lower HighThe U.S. Oil Fund ETF has been ripping since December. But now it may be showing signs of fatigue.
The main pattern on today’s chart is the lower high on March 23 versus March 8. That could suggest prices are entering a longer period of consolidation – possibly with an ABC correction resolving below the March 16 low of $67.73.
Next is the high-volume spinning top earlier this month. That’s a potential reversal candle.
Third, the equity market is giving some potential warning signs because the SPDR Energy ETF has started lagging the S&P 500. (This chart features our Smart Relative Strength script.) XLE could be important because it broke out to new highs a full week before USO (January 5 versus January 12). Its underperformance now is also potentially bearish:
Finally, the news cycle may be less positive for oil as China battles coronavirus and diplomats seek an end to the Ukraine conflict. OPEC+ is expected to stick with a small production increase on Thursday, which is bullish. Will traders “sell the news” after the event?
TradeStation has, for decades, advanced the trading industry, providing access to stocks, options, futures and cryptocurrencies. See our Overview for more.
Important Information
TradingView is not affiliated with TradeStation Securities Inc. or its affiliates. TradeStation Securities, Inc., TradeStation Crypto, Inc., and TradeStation Technologies, Inc. are each wholly owned subsidiaries of TradeStation Group, Inc., all operating, and providing products and services, under the TradeStation brand and trademark. When applying for, or purchasing, accounts, subscriptions, products and services, it is important that you know which company you will be dealing with. Please click here for further important information explaining what this means.
This content is for informational and educational purposes only. This is not a recommendation regarding any investment or investment strategy. Any opinions expressed herein are those of the author and do not represent the views or opinions of TradeStation or any of its affiliates.
Investing involves risks. Past performance, whether actual or indicated by historical tests of strategies, is no guarantee of future performance or success. There is a possibility that you may sustain a loss equal to or greater than your entire investment regardless of which asset class you trade (equities, options, futures, or digital assets); therefore, you should not invest or risk money that you cannot afford to lose. Before trading any asset class, first read the relevant risk disclosure statements on the Important Documents page, found here: www.tradestation.com .

Two magic boxes..Might be time to keep an eye on your oil long if you are long in it.... would prefer it hits the top box and I would be looking for a potential short there to send oil back down.... keep an eye on the way it climbs and how fast.....

USO back to the (lower) 70'sShort: intraday/days (stop above 81)
Long: weeks & months
Energy is in a structural bull trend as long as the major MA's hold, while hourly becoming overbought with declining volume, need more consolidation in the short term.

Oil Demand and Supply ImbalanceSince Covid over have good channel, sure got overextended, but just gives you an idea of how far we will go. For what reason would oil demand ever go down? And for what reason would oil supply ever increase? May looks like good target for back to $85. Was thinking some oil producers but with Elizabeth Warren on the hunt I think not.


playing out as predicted 📊USO last post I said the top was in and got lots of hate. looks like I was right though. :)
look for more downside once we break back below that trend resistance. 62-64 short term is very possible

If USO gets into the 67s within the next day or soI would consider going long with a stop just a little under it........... just for a quick trade. Remember, oil moves around the clock so gap ups and downs are part of the game here.. size appropriately and use a stop.

Looking to see oil continue to fall this week...Can we get as low as the 68s? I dont think so... more about 69/ 70 level maybe. Well see... ignore the news... it's just a chart.

USO: The most politically charged ETF USO has my attention.
Hi USO, How are you?
If you know my trading style, you know I am a quant trader and I am now in the process of developing a working model of USO. But while USO and I get acquainted, intimately ;), I wanted to speak philosophically about the idea of an ETF based on oil and just about the energy sector as a whole.
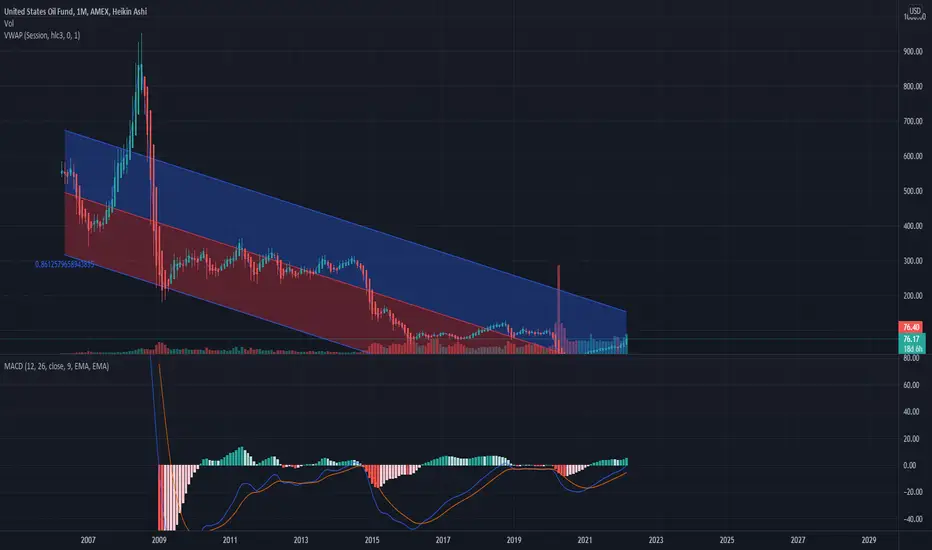
I had frequently posted in XOM and one thing I had noticed was that XOM finally was able to break out of essentially a 7 to 8 ish year downtrend. The oil based energy sector as a whole has seen this kind of prolonged downtrend, with USO being no different, as evidenced by this monthly candlestick chart. At its zenith, USO was trading slightly over $950.
It has only been hemorrhaging money since its peak, as has all oil based energy companies. In fact, it has been a terrible ETF that causes investors to slowly ooze their money and not stably grow their investments as with any other ETF. In fact, energy and oil has been trading inversely that of green energy stocks. For example, if we look at NextEra energy (NYSE: NEE) below, we will see, as oil and energy stocks decline, NEE increased:
Green energy ETFs are kind of novel and haven't been around long enough to truly compare with USO, but they have equally been performing terribly. Let's take a look at some.
Here is ICLN, a green energy ETF
You will notice here, that inverse relationship as pointed by the yellow arrow. As oil and non-renewable energy grows, green declines. And the inverse is true, as Oil prices declines, green energy rises.
So what gives?
This is where the philosophically/politically charged nature of these ETFs come in. Which is better? Dirty, antiquated, polluting oil stocks? Or clean, natural resource intensive and toxic byproduct producing green energy like solar and wind?
In all honesty, I truly believe it comes down to politics. Oil and "dirty" energy producing stocks fell out of fashion with the pro-enviornment movement and emphasis on renewable energy sources. This has led to an under performance of oil stocks (in my opinion) and an over-performance of green energy stocks.
In this great correction we are seeing in 2022, what we are in fact witnessing is the rightful correction of stocks back to natural states. Oil does not deserve to be at this price, IMO. No matter where you stand on the dirty vs clean energy debate, oil continues to be pivotal for society.
Green energy is equally pivotal. We need both. We cannot rely completely on one source of energy.
I believe we are seeing a massive correction in both industries where these stocks are returning to their rightful price. I do believe oil will continue to rise. We need pull backs of course, we can't just go straight up, but the fact is, oil remains a pivotal part of society.
Green energy is also pivotal and I believe that once we see stabilization in these stocks, we hopefully can understand that both industries are pivotal for societal and economic growth.
Sadly, both green energy and oil stocks have been tarnished by politics. Politics has a funny habit of ruining things. From the times of the liberal free 80s and 90s where anything went and, who really cares?! To now, where everything must be categorized, studied, labelled and discussed, from our personal identities and now to our investment choices.
But I still hold out hope for USO! And also for clean energy. I have avoided investing in either or (with the exception of XOM) because of the political stigma's surrounding them and the fact that those stigmas have translated to unnatural growth and decline. But I see things are turning around and I will be the first to jump on that band wagon to re-join!
Disclaimer!
Not investment advice!
I am PRO green energy, even in the process of buying an electric car (which I understand really are not environmentally friendly haha); but I recognize the need for both energy sources and investment in both fields!
Top Reached on US OILFollowing my previous Idea of the big bearish Harmonic Cypher on US OIL, we continue.
#Price action Analysis
If we analyze price action, we can see on USO on left, on green boxes on before days you needed 20m shares to move the price about 4% up. Yesterday, USO traded 30m shares to move the price nowhere, Wyckoff simple offer/demand, if you push a rock 4%, and later you needed a lot more force to move the same rock 0%, means that someone is pushing the rock from the other side really hard right? The same happens here. Offer/Demand.
On the right we have a candlestick pattern where the red candle takes over the green one from yesterday, that's a reversal pattern.
#Long price term Analysis
if you followed my before days chart, I put a bearish Cypher with a target near this area, we come from 0 from Covid FUD to 126 without a major correction, not a simple .386 Fibonacci retracement at all.
I think if you jumped to oil just because everyone is buying, you will get rekt probably, I expect a .386 retracement to 100-80s at least, in the following weeks/months.
What will happen next?
I think after the pullback to 80-100s this might continue to test an ATH break maybe, I am not sure, but a correction is more than needed at these prices at this point on the trend.


Short $USO?I know no one thinks oil is going to go lower after the run we've been having and the fact that there's a shortage of oil supply due to the conflict with Russia/Ukraine, but the chart is telling me a different story.
I don't know what could cause a pullback, but I could see $USO falling back the $56-62 support levels sometime over the next few weeks before continuing higher. Definitely a high-risk trade and I'm playing it through options... let's see how it plays out.

Will the Oil Boom Last? Watch the US / Saudi relationshipHow long will the oil boom last? How much of an impact will Russian isolation have on the oil market and overall inflation? Biden has been cool to the Saudi's since he took office, after Trump cultivated an unusually close relationship with them. Unlike Biden, Trump seemed to have a predatory view of oil prices. I mean, he would do whatever it took to keep gas cheap.
The longer this debacle (and its aftermath) goes on in Ukraine the more opportunity and incentive the US will have to tank the oil market. With such a large portion of GDP made up of oil, Russia is very susceptible to a deflationary spiral in oil cost. To a certain extent, oil is financing Russia's military operation since the more trouble they cause, the more their primary export is worth. While the initial inclination of the US is to isolate Russia and its oil sales this move may benefit Russia to some extent, since supply in the world will be lower they'll still likely be able to make deals to move their oil through neutral countries. However, the more this bites at the American inflation problem, the more pressure there will be to increase output. Most of the incentives will run toward increasing output; Russia will hurt more if its primary export drastically decreases in value, and the move will alleviate some inflation in western countries. After all, who will even remember why Biden has shunned the Saudis? When gas is $5+ will you cry about Yemen, especially if you can get cheaper gas and hurt Russia at the same time? Will you think of Khashoggi if it helps Ukraine? Your moral scruples will be intact and gas can be cheaper! And wtf the Climate? Who cares. That is the political calculus of the next 2 years.
When you see Washington getting closer to the Saudis then be skeptical of oil prices. They can really make Russia pay this way. Of course, domestic producers have been betrayed so much over the past decade that they won't just come back online; they'll need assurances.
Also, just for 'fun', here are some more predictions (more like possibilities):
- Without a critical mass Belarussian forces joining, Russia will not take Kyiv and the government will remain intact, but will hold the majority of the eastern country.
- Even if Russia can take Kyiv on it's own, it will take so long that it will undermine its bargaining position and be a strategic (at least politically) defeat.
- Trump will at least make a statement about offering to 'broker' a peace of some sort. No one will accept.
- Inflation will get bad enough that the Biden admin will treat with the Saudi's and try to smooth over their bad relationship in order to convince them to put pressure on oil prices.
- The US will contemplate how they can engender the same resistance morale in Taiwan and there will be talk of resurrecting something like the TPP (Obama era) in order to provide a coalition to oppose China economically.

USOThought this was going to blow right through the 1.618 extension/blue uptrend line when I saw oil last night. Looks like these resistance levels might hold after all. Bearish below $67.
