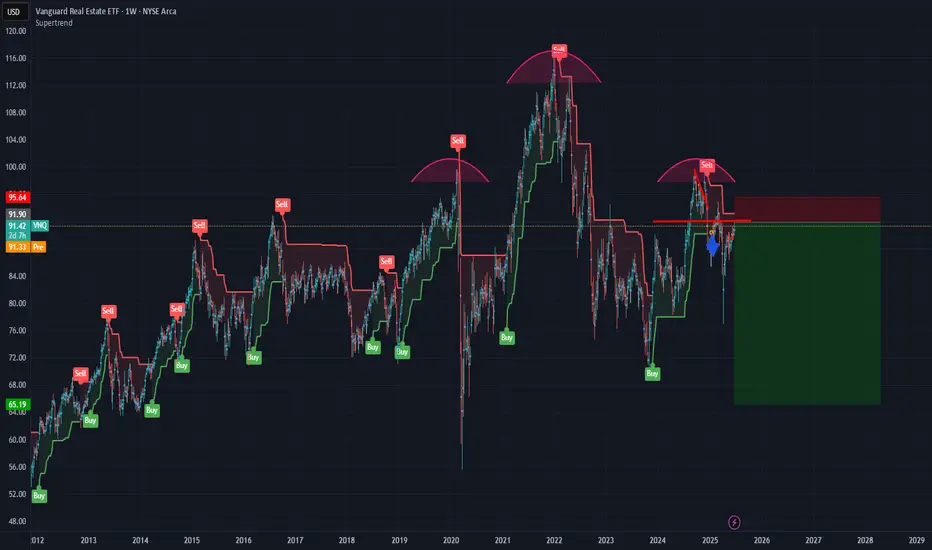
Adding DRV in this area. VNQ going downThe golden age is over. Actually I have no idea what I am doing other than throwing darts at the dart board. This trade may work, it may not.
Key stats
About Vanguard Real Estate ETF
Home page
Inception date
Sep 23, 2004
Structure
Open-Ended Fund
Replication method
Physical
Dividend treatment
Distributes
Distribution tax treatment
Ordinary income
Income tax type
Capital Gains
Max ST capital gains rate
39.60%
Max LT capital gains rate
20.00%
Primary advisor
The Vanguard Group, Inc.
Distributor
Vanguard Marketing Corp.
VNQ tracks a broad index that captures much of the US real estate market. The fund holds a deep basket and its market-cap allocations mirror those of our neutral benchmark. The only place it deviates is the persistent sector bias away from specialized REITs in favor of commercial REITs. As a result of excellent portfolio management, at times, the cost of owning VNQ has even been lower than its stated expense ratio. The only blemish we see is the fact that Vanguard discloses holdings monthly rather than daily. However, this is a nuisance at most in a low-turnover fund, and immaterial to many investors. As with peer REIT ETFs, distributions from the fund are taxed as ordinary income. Prior to February 1, 2018 the fund tracked the MSCI US REIT Index. During the period of February 1 to July 24, 2018, the fund tracked the MSCI US Investable Market Real Estate 25/50 Transition Index. Effective July 25, 2018 the fund tracked the MSCI Investable Market Real Estate 25/50 Index.
Related funds
Classification
What's in the fund
Exposure type
Finance
Stock breakdown by region
Top 10 holdings
VNQ/SPY Stagflation trade?Surprised to see reits continue their underperformance against the S&P, I understand how most market participants view reits as a long term rate play (yields down reits up etc) however I think the market is not taking into account that reits should perform "relatively" well in a stagflationary envir


pivot playEntering here via DRV for a short trade. Bail if the daily closed above the entry (circle).

Low Risk via DRVUsing DRV to short VNQ off this pivot. Hopefully it holds, limited losses if the sell pivot holds.

A longer term entry for short VNQ via DRVI will be dabbling with DRV until this Monthly goes back to a buy. I think this is a position of maximum opportunity to enter short real estate.

Warning Shot Based on the previous CoT report, asset managers are short the Real Estate index 9,247 contracts which is 1,184% more than their average in 2020, and 840% more than their average 2019 positioning. Large deviations in asset manager positioning are good indicators of sentiment and risk.
For example,


Why im all in on Vanguard Real Estate ETFAs a thirty-something-year-old investor, I’ve been contemplating my investment strategy. Diversification is a common recommendation, but is it truly my best approach? For me, dividends play a critical role, especially if they’re paid monthly.
My background as an XAU/USD trader has shaped my perspec

Commercial real estateThe golden years are over, the market is going to be in for a reckoning somewhere some how.
Technical + bias on this play.

See all ideas
Summarizing what the indicators are suggesting.
Oscillators
Neutral
SellBuy
Strong sellStrong buy
Strong sellSellNeutralBuyStrong buy
Oscillators
Neutral
SellBuy
Strong sellStrong buy
Strong sellSellNeutralBuyStrong buy
Summary
Neutral
SellBuy
Strong sellStrong buy
Strong sellSellNeutralBuyStrong buy
Summary
Neutral
SellBuy
Strong sellStrong buy
Strong sellSellNeutralBuyStrong buy
Summary
Neutral
SellBuy
Strong sellStrong buy
Strong sellSellNeutralBuyStrong buy
Moving Averages
Neutral
SellBuy
Strong sellStrong buy
Strong sellSellNeutralBuyStrong buy
Moving Averages
Neutral
SellBuy
Strong sellStrong buy
Strong sellSellNeutralBuyStrong buy
Displays a symbol's price movements over previous years to identify recurring trends.
Frequently Asked Questions
An exchange-traded fund (ETF) is a collection of assets (stocks, bonds, commodities, etc.) that track an underlying index and can be bought on an exchange like individual stocks.
VNQ trades at 91.73 USD today, its price has risen 0.01% in the past 24 hours. Track more dynamics on VNQ price chart.
VNQ net asset value is 91.75 today — it's risen 3.98% over the past month. NAV represents the total value of the fund's assets less liabilities and serves as a gauge of the fund's performance.
VNQ assets under management is 34.58 B USD. AUM is an important metric as it reflects the fund's size and can serve as a gauge of how successful the fund is in attracting investors, which, in its turn, can influence decision-making.
VNQ price has risen by 0.90% over the last month, and its yearly performance shows a 3.47% increase. See more dynamics on VNQ price chart.
NAV returns, another gauge of an ETF dynamics, have risen by 3.98% over the last month, showed a 6.50% increase in three-month performance and has increased by 7.93% in a year.
NAV returns, another gauge of an ETF dynamics, have risen by 3.98% over the last month, showed a 6.50% increase in three-month performance and has increased by 7.93% in a year.
VNQ fund flows account for −537.59 M USD (1 year). Many traders use this metric to get insight into investors' sentiment and evaluate whether it's time to buy or sell the fund.
Since ETFs work like an individual stock, they can be bought and sold on exchanges (e.g. NASDAQ, NYSE, EURONEXT). As it happens with stocks, you need to select a brokerage to access trading. Explore our list of available brokers to find the one to help execute your strategies. Don't forget to do your research before getting to trading. Explore ETFs metrics in our ETF screener to find a reliable opportunity.
VNQ invests in stocks. See more details in our Analysis section.
VNQ expense ratio is 0.13%. It's an important metric for helping traders understand the fund's operating costs relative to assets and how expensive it would be to hold the fund.
No, VNQ isn't leveraged, meaning it doesn't use borrowings or financial derivatives to magnify the performance of the underlying assets or index it follows.
In some ways, ETFs are safe investments, but in a broader sense, they're not safer than any other asset, so it's crucial to analyze a fund before investing. But if your research gives a vague answer, you can always refer to technical analysis.
Today, VNQ technical analysis shows the buy rating and its 1-week rating is strong buy. Since market conditions are prone to changes, it's worth looking a bit further into the future — according to the 1-month rating VNQ shows the strong buy signal. See more of VNQ technicals for a more comprehensive analysis.
Today, VNQ technical analysis shows the buy rating and its 1-week rating is strong buy. Since market conditions are prone to changes, it's worth looking a bit further into the future — according to the 1-month rating VNQ shows the strong buy signal. See more of VNQ technicals for a more comprehensive analysis.
Yes, VNQ pays dividends to its holders with the dividend yield of 3.78%.
VNQ trades at a premium (0.02%).
Premium/discount to NAV expresses the difference between the ETF’s price and its NAV value. A positive percentage indicates a premium, meaning the ETF trades at a higher price than the calculated NAV. Conversely, a negative percentage indicates a discount, suggesting the ETF trades at a lower price than NAV.
Premium/discount to NAV expresses the difference between the ETF’s price and its NAV value. A positive percentage indicates a premium, meaning the ETF trades at a higher price than the calculated NAV. Conversely, a negative percentage indicates a discount, suggesting the ETF trades at a lower price than NAV.
VNQ shares are issued by The Vanguard Group, Inc.
VNQ follows the MSCI US IMI/Real Estate 25-50. ETFs usually track some benchmark seeking to replicate its performance and guide asset selection and objectives.
The fund started trading on Sep 23, 2004.
The fund's management style is passive, meaning it's aiming to replicate the performance of the underlying index by holding assets in the same proportions as the index. The goal is to match the index's returns.