WEAT on the move?Wheat futures (ZW) have cleared a zone of resistance with a 4.6% one day move. As tracked by the WEAT ETF, current price seems to be heading for a retest of the 200 Daily SMA (currently at $4.90). The 200 Daily SMA has reversed previous attempts to break out in October 2024 and February 2025. Will third time be different?
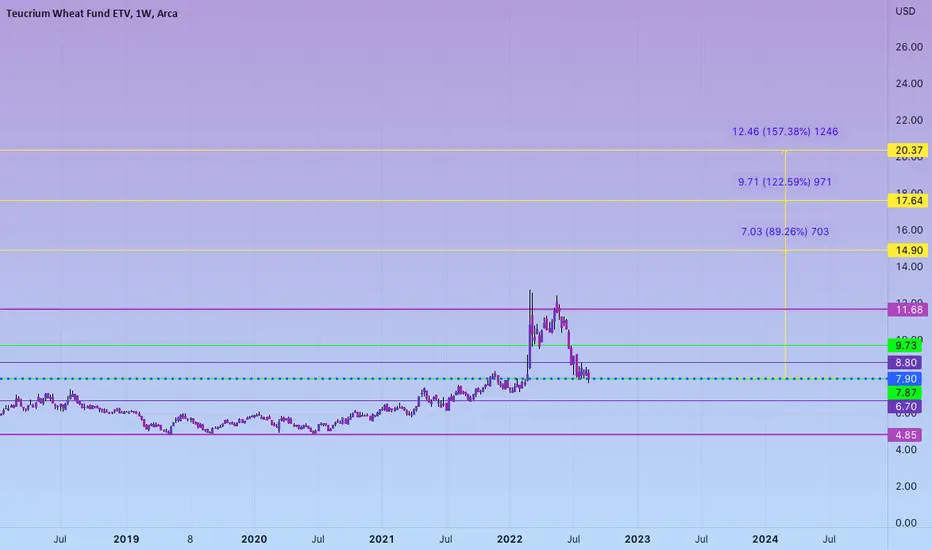
Note that this ETF reached a high over $12 in 2022 when the Russian/Ukrainian war started.
WEAT trade ideas

WEAT impending breakout on volumeThe WEAT ETF has been building a base with an accompanying increase in volume over the past two weeks. First resistance would most likely be the 200 DMA.

WEAT getting ready to test its 200 MA for the 7th time!AMEX:WEAT
WEAT has been in a secular bearish trend for over 15 years. But that has not been without bullish bursts. However something happened to WEAT recently were it successfully broke out thru its 200 DMA in April of last year. In my opinion this signaled the beginning of a change in trend for WEAT. Normally stocks shift from Bearish to Range then to Bullish. They typically require a consolidation phase in the middle. WEAT ranged in 2019 after a bearish trend then broke out in 2020 for a 150% increase. However, I am not going to bet the farm on that. There is money to be made in trading the range. This is when we buy low and sell high as appose to momentum trade. I am going to buy WEAT @ $4.66 and sell half of my position at the 200 MA (about $5.20) for a 10% profit. From there I shall ride the rest to see how far we can go.
Anyway, this is what I am doing with my money, you do you.
Good luck.

WEATBULLISH ON WEAT - Of course, I'm paper trading it but will be accumulating soon. AMEX:WEAT www.tradingview.com

CANE and WEAT LONGboth broken long term trendlines to the upside.
Additionally, CANE is in season. MASSIVE inverse HS on CANE with 275% upside potential 2-5 yrs
Please watch video for a more detailed explanation

WEAT (Wheat): Forming Huge “W” to Culminate in 2032/33? 9.13.24
MA's need to flatten out, like last time before bull run (2019-2020).
Base was built over 13 - 21 months, depending how you measure it. (13 mo from 1st bottom to 3rd bottom)
There was a triple-bottom (or quadruple/quintuple bottom, depending how you look at it), before going from $4.83 to $12.63.
Extrapolating, potential (last) bottom around Sep 2025 (~$4.83), before possibly breaking out of range around Apr 2026.
Targets:
$12.63
$17.52
$25.40 - $25.94
It's forming a huge "W" which would culminate in 2032/33... though if the stock market is going to crash in 2026/27, I doon't see how the price could keep rising past that point.
So caution with this one... wait for breakout between Sep 2025 and Apr 2026, though this one might lose any potential momentum once economy starts crashing.

WEAT | Wheat Will Fly High Soon!Teucrium Wheat seeks to have the daily changes in the Shares' NAV reflect the daily changes of the price of wheat for future delivery, as measured by the Teucrium Wheat Index. The fund seeks to achieve its investment objective by investing in Benchmark Component Futures Contracts. Under normal market conditions, the manager expects that 100% of the fund's assets will be invested in benchmark component futures contracts and in cash and cash equivalents.

WEAT just entered a buy zone for a swing trade.Exceptional risk/reward here of 8.6 with stop loss and PT's as shown below. Tight stop is essential.

EU faces pressure to defuse mounting anger as farmers protest aGiven the mounting anger and protests by farmers across Europe, there appears to be a significant challenge stemming from contradictory and potentially detrimental agricultural policies. The grievances include increased costs for agricultural diesel, additional fees for water consumption, complex regulations, and objections to bans on pesticides and herbicides mandated by the EU's Green Deal. The farmers are also concerned about the import of beef from countries like Brazil and Argentina, which they argue have laxer rules on animal welfare, making competition difficult.
This unrest, originating in France but spreading to neighboring countries, signals a broader issue with unpredictable government decisions affecting agriculture. In the Netherlands and Germany, similar protests have arisen over regulations to cut nitrogen emissions and phase out fuel subsidies, respectively. In Germany, there is also resentment over what is perceived as the unfair application of environmental policies.
With protests extending to Poland, Romania, Slovakia, Hungary, and Bulgaria, concerns range from unfair competition from cut-price cereals to high taxes and tight regulations. The impact of droughts, floods, and wildfires, combined with the squeeze from green policies, has fueled discontent.
For investors, this could be a pivotal moment to consider commodities such as cereals, soybeans, and copper. The disruptions in European agriculture may create fluctuations in the market, making these commodities potentially attractive for investment. However, it is crucial to monitor developments closely as tensions continue to grow, and the agricultural sector shapes up to be a major issue in the upcoming European Parliament elections in June.

Teucrium WEAT - Looks like a powerful chart. Double bottom and now sitting back at an area of support. Strong W pattern in the making. Bottom close?
Everyone needs bread! Get your wheeties while they're cheap. My opinion is that commodities will be strong buys long term

WEAT- Wheat ETF at buy point LONGWEAT the Wheat EFT has been volatile of late due to the Bakc Sea shipping deal
falling apart when Russia refused to renew it. Brazil has been trying to increase
whet exports to pick up from the fall off of Ukrainian shipments to Africa and others.
On the 4H chart, WEAT has fallen 15% from the double tops of July demonstrating
the high volatility in what is typically a slow-moving commodity. WEAT is now
5% above the support trendline and about 14% below the horizontal resistance of
those double tops. This is a favorable r:R ratio. I will go long here assuming there
is now breakthrough in the near future with the resumption of the Black Sea grain
deal to impact the supply-demand imbalance and destabilize the price rise. I will
look into a call option trade as well.

Wheat deal in the Black Sea- Strike Causes Price Rise LONGWEAT is a popular ETF tracking wheat as a commodity. Because of geopolitical issues
the rising price is an escalator for basic food prices from Africa to USA and globally.
Sugar is a commodity that always seems to rise. Here on this daily chart, I have plotted
the ratio of wheat to sugar spot prices which typically is a falling ratio. However, the
downtrend pivoted to coincide with the wheat deal for Ukraine falling apart and pressuring
commodity prices. On the RSI indicator both low TF and highTF are rising and are not
overall to strong. I can easily conclude that wheat is a safe long bet a slow mover that
might be low risk in what right now is a chaotic and volatile market that could be topping out.
There is no expected flip of the wheat price trend until the geopolitical winds change
direction. I will open a long position in WEAT and check CORN for a similar analysis.

WEAT- an agricultural ETF for wheat futures.WEAT is essentially tracking wheat future contracts of various lengths. Importantly, the war in
Ukraine took a disastrous turn when the Russians sabotaged a major dam subjecting thousands
of acres of farmland to potential flooding and compromising the cooling pools for the nuclear
electric generating plant that services a multitude of people. Urkaine is sometimes called the
the breadbasket of the world due to its wheat crops which are due to be harvested. Flooding
will disrupt or prevent harvesting altogether. The 15-minute chart here shows movement of
WEAT price over the first part of this month. While WEAT does not offer s high reward ROI,
it is a low-risk trade for a reasonable return. The issue in Ukraine in dire and will not resolve
easily; its impact on wheat prices cannot be overstated.


Continuation Wedge (Bullish) | 20% move possibleTeucrium Wheat Fund forms bullish "Continuation Wedge" chart pattern
"Continuation Wedge (Bullish)" chart pattern formed on Teucrium Wheat Fund (WEAT:NYSE). This bullish signal indicates that the stock price may rise from the close of $7.03 to the range of $8.30 - $8.60. The pattern formed over 28 days which is roughly the period of time in which the target price range may be achieved, according to standard principles of technical analysis.
Tells Me: After a temporary interruption, the prior uptrend is set to continue.
A Continuation Wedge (Bullish) represents a temporary interruption to an uptrend, taking the shape of two converging trendlines both slanted downward against the trend. During this time the bears attempt to win over the bulls, but in the end the bulls triumph as the break above the upper trendline signals a continuation of the prior uptrend.

Trade Journal - WEAT, Jan 19 (long)Trade Journal - WEAT, Jan 19 (long)
Thesis
Last year, inflation was high due to increased input costs of oil. Russia's invasion of Ukraine created supply issues and an increase in demand / reduction in supply. However, WEAT did not perform as expected, and only saw mild gains.
In retrospect, this seems to have been due to pulling from 2021's supply of grains. The thesis remains the same, except that 2022 will have had higher oil input costs priced into the commodity. Therefore, come september, we should see a much higher uptick than last year.
From May 2020 onward, and ignoring the pandemic era, there is a clear support line that the price has fallen below. However, commodities are driven by supply & demand. In keeping with my original thesis, prices might be very cheap right now. On the other hand, people might have planted more wheat this year due to the invasion.
Remember that this is an ETF that tracks commodity prices via futures - the long term chart history shows the same pattern that you get from reverse splits / leveraged ETFs doing poorly. Therefore, we might be able to trust drawings and should rely on technicals.
It also happens to resemble the "asset bubble chart" and it had the double top into a mean reversion.
Tracking
Jan 19
+ Went long 200 shares to have exposure to wheat for long term
- Did not use TA, but some signals indicate an entry. It crossed above the baseline and C1 agreed.
- More TA should be used next time, including volume and C2.
- Exit price is projected to be 10.64 by Nov 1st, based on the 0.618 fib level. Realistically, this should be calculated based on macro factors for a long term commodity trade.
- Position size should be approx 760 shares, not 200. We did not accept enough risk. We could DCA in on the dips / periods of low volatility.
- This is a long term investment-style trade, rather than a trend trade. We don't have a system for that yet. However, we have a defined target of 9.60 to 10.64 by November. ATR is still being tracked for position sizing.
Trades
Jan 19, +200 @ 7.54 (4.95 fee)
Outcome
Ongoing.

$WEAT: Nice trend reversalNice setup in #Wheat here, might prove to be a long lasting bottom if this setup works right away...
Best of luck!
Cheers,
Ivan Labrie.


WEAT is starting to budInteresting area here on WEAT. Support area. Daily divergence and oversold otherwise. Seasonality is positive. Stop would be any move below recent low. Targets tbd.

WEAT | Starting a Position Here | LONGThe fund seeks to achieve its investment objective by investing in Benchmark Component Futures Contracts. Under normal market conditions, the manager expects that 100% of the fund's assets will be invested in benchmark component futures contracts and in cash and cash equivalents.

$WHEAT ETV FORECASTWhats going up when markets going down pt1
not a supply chain specialist but im pretty sure
with drought weather, inflation and rising gas prices
SENNA SEASON
WHEAT breakout long entryWHEAT had a beautiful breakout candle yesterday, breaking the prior consolidation zone. I'm most interested in this idea because once I ran fib retracements there is so much alignment: 618 is perfect prior support, 0.5 is a teeeeny tiny gap, 382 is a consolidation zone, and we've defeated 236.
Follow through and it is off to $10 at minimum. TP/SL targets pictured on chart.
SL: trade setup invalidated with a daily close below 8.45.
TP: $10 and above, depending on how you trade

Strong weekly hidden bullish divergence on #WEAT EFTHigher-low in price and lower-low in RSI. Big move incoming?
