Continuation Wedge (Bullish) | 37% move possibleDirexion Daily Dow Jones Internet Bear 3X Shares forms bullish "Continuation Wedge" chart pattern
"Continuation Wedge (Bullish)" chart pattern formed on Direxion Daily Dow Jones Internet Bear 3X Shares (WEBS:NYSE). This bullish signal indicates that the stock price may rise from the close of $20.3
Key stats
About Direxion Daily Dow Jones Internet Bear 3X Shares
Home page
Inception date
Nov 7, 2019
Structure
Open-Ended Fund
Replication method
Synthetic
Dividend treatment
Distributes
Distribution tax treatment
Ordinary income
Income tax type
Capital Gains
Max ST capital gains rate
39.60%
Max LT capital gains rate
20.00%
Primary advisor
Rafferty Asset Management LLC
Distributor
Foreside Fund Services LLC
WEBS is passively managed to provide 3x daily inverse exposure to the Dow Jones Internet Composite Index. The index is composed of the 40 largest and most actively traded U.S. internet technology and commerce companies. Companies selected are determined by the Index Provider to derive a majority of their sales from activities such as online retail, social media, advertising, travel platforms, cloud computing or digital marketing. Because of daily rebalancing and the compounding over time, the return of the Fund for periods longer than a day, will very likely differ from -300% of the return of the Index over the same period.
Related funds
Classification
What's in the fund
Exposure type
Cash
Bonds, Cash & Other100.00%
Cash100.00%
Top 10 holdings

Stock Opinion - WEBS and WEBLWEBS and WEBL are workhorse 3X etfs and you can't go wrong playing both if your a swing trader. They do not have the volume nor volatility other 3X ETF's have which I like because it tends to move in a sophisticated cadence. If that makes sense.
I had stopped trading WEBS and WEBL but found I misse

Interesting SetupCame up with this indicator and Renko chart configuration. Discrete versus analog style which I prefer. SMAs set at 2,4,6,8. Stoch RSI set to k=3, d=2 RSI length=1, stochastic length=2 RSI source=close. DPO Timeframe=Chart, Length=1, Centered.

Ascending TrianglePrice is at resistance.
Neutral pattern until broke.
No recommendation.
Leveraged.
Direxion Shares ETF Trust - Direxion Daily Dow Jones Internet Bear 3X Shares is an exchange traded fund launched by Direxion Investments. It is managed by Rafferty Asset Management, LLC. It invests in public equity m

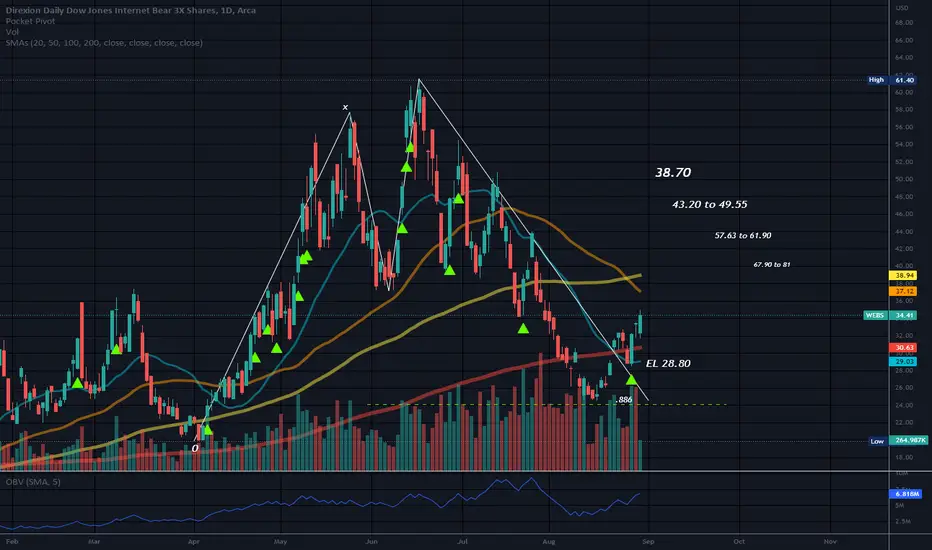
Bullish SharkLeveraged and Volatile. This moves 3 times the market moves both up and down.
Crooked M.
Last leg down appears to have terminated at the .886.
Peak 2 is higher than peak 1.
No recommendation.
Possible stop under 23 or where you see support.
Direxion Shares ETF Trust - Direxion Daily Dow Jones
See all ideas
Summarizing what the indicators are suggesting.
Oscillators
Neutral
SellBuy
Strong sellStrong buy
Strong sellSellNeutralBuyStrong buy
Oscillators
Neutral
SellBuy
Strong sellStrong buy
Strong sellSellNeutralBuyStrong buy
Summary
Neutral
SellBuy
Strong sellStrong buy
Strong sellSellNeutralBuyStrong buy
Summary
Neutral
SellBuy
Strong sellStrong buy
Strong sellSellNeutralBuyStrong buy
Summary
Neutral
SellBuy
Strong sellStrong buy
Strong sellSellNeutralBuyStrong buy
Moving Averages
Neutral
SellBuy
Strong sellStrong buy
Strong sellSellNeutralBuyStrong buy
Moving Averages
Neutral
SellBuy
Strong sellStrong buy
Strong sellSellNeutralBuyStrong buy
Displays a symbol's price movements over previous years to identify recurring trends.
Frequently Asked Questions
An exchange-traded fund (ETF) is a collection of assets (stocks, bonds, commodities, etc.) that track an underlying index and can be bought on an exchange like individual stocks.
WEBS trades at 20.17 USD today, its price has fallen −1.61% in the past 24 hours. Track more dynamics on WEBS price chart.
WEBS net asset value is 20.16 today — it's fallen 7.84% over the past month. NAV represents the total value of the fund's assets less liabilities and serves as a gauge of the fund's performance.
WEBS assets under management is 9.15 M USD. AUM is an important metric as it reflects the fund's size and can serve as a gauge of how successful the fund is in attracting investors, which, in its turn, can influence decision-making.
WEBS price has fallen by −10.44% over the last month, and its yearly performance shows a −71.99% decrease. See more dynamics on WEBS price chart.
NAV returns, another gauge of an ETF dynamics, have fallen by −7.84% over the last month, showed a −41.14% decrease in three-month performance and has decreased by −71.34% in a year.
NAV returns, another gauge of an ETF dynamics, have fallen by −7.84% over the last month, showed a −41.14% decrease in three-month performance and has decreased by −71.34% in a year.
WEBS fund flows account for 8.24 M USD (1 year). Many traders use this metric to get insight into investors' sentiment and evaluate whether it's time to buy or sell the fund.
Since ETFs work like an individual stock, they can be bought and sold on exchanges (e.g. NASDAQ, NYSE, EURONEXT). As it happens with stocks, you need to select a brokerage to access trading. Explore our list of available brokers to find the one to help execute your strategies. Don't forget to do your research before getting to trading. Explore ETFs metrics in our ETF screener to find a reliable opportunity.
WEBS invests in cash. See more details in our Analysis section.
WEBS expense ratio is 1.08%. It's an important metric for helping traders understand the fund's operating costs relative to assets and how expensive it would be to hold the fund.
WEBS is an inverse fund, meaning it's structured to generate returns opposite to the trends of the underlying index or assets.
In some ways, ETFs are safe investments, but in a broader sense, they're not safer than any other asset, so it's crucial to analyze a fund before investing. But if your research gives a vague answer, you can always refer to technical analysis.
Today, WEBS technical analysis shows the sell rating and its 1-week rating is sell. Since market conditions are prone to changes, it's worth looking a bit further into the future — according to the 1-month rating WEBS shows the sell signal. See more of WEBS technicals for a more comprehensive analysis.
Today, WEBS technical analysis shows the sell rating and its 1-week rating is sell. Since market conditions are prone to changes, it's worth looking a bit further into the future — according to the 1-month rating WEBS shows the sell signal. See more of WEBS technicals for a more comprehensive analysis.
Yes, WEBS pays dividends to its holders with the dividend yield of 7.77%.
WEBS trades at a premium (0.07%).
Premium/discount to NAV expresses the difference between the ETF’s price and its NAV value. A positive percentage indicates a premium, meaning the ETF trades at a higher price than the calculated NAV. Conversely, a negative percentage indicates a discount, suggesting the ETF trades at a lower price than NAV.
Premium/discount to NAV expresses the difference between the ETF’s price and its NAV value. A positive percentage indicates a premium, meaning the ETF trades at a higher price than the calculated NAV. Conversely, a negative percentage indicates a discount, suggesting the ETF trades at a lower price than NAV.
WEBS shares are issued by Rafferty Asset Management LLC
WEBS follows the DJ Internet Composite. ETFs usually track some benchmark seeking to replicate its performance and guide asset selection and objectives.
The fund started trading on Nov 7, 2019.
The fund's management style is passive, meaning it's aiming to replicate the performance of the underlying index by holding assets in the same proportions as the index. The goal is to match the index's returns.