XBI eyes on $79.28: Golden Covid fib may mark the BioTech bottomXBI has been getting dumped since Trump and RFK
If biotech is to recover, it might start here and now.
Bulls need to hold or at least orbit this a few times.
XBI trade ideas

XBI-SPY overlay unravels great bear?Undead Bear Captain's Log, Apr 7 2025:
Writing some observations due to a lurking feeling of something ominous about to happen:
Bizarre signs in the wind since mid-March, such as VVIX/VIX
Sudden downslide last week, almost unprecedented
Minimal put action - bear breathen all obliterated
Overlay of infant XBI and adolescent SPY suggests 3 year rally was nothing more than smoke & mirrors
XBI bearish running flat?
SPY extreme expanded flat?
If true, this could sink ships - many many ships...
Out

Opening (IRA): XBI May 16th -91C/October 17th 60C LCD*... for a 26.56 debit.
Comments: Back in to XBI on weakness, buying the back month 90 delta and selling the front month that pays for all of the extrinsic in the long. (The back month 60C is shown at the 80 so that it fits on the chart).
Metrics:
Buying Power Effect: 26.56
Break Even: 86.56
Max Profit: 4.44
ROC at Max: 16.72%
50% Max: 2.22
ROC at 50% Max: 8.36%
Will generally look to take profit on the setup as a unit at 50% max, roll out the short call at 50% max to reduce my downside break even.
* -- Long call diagonal.

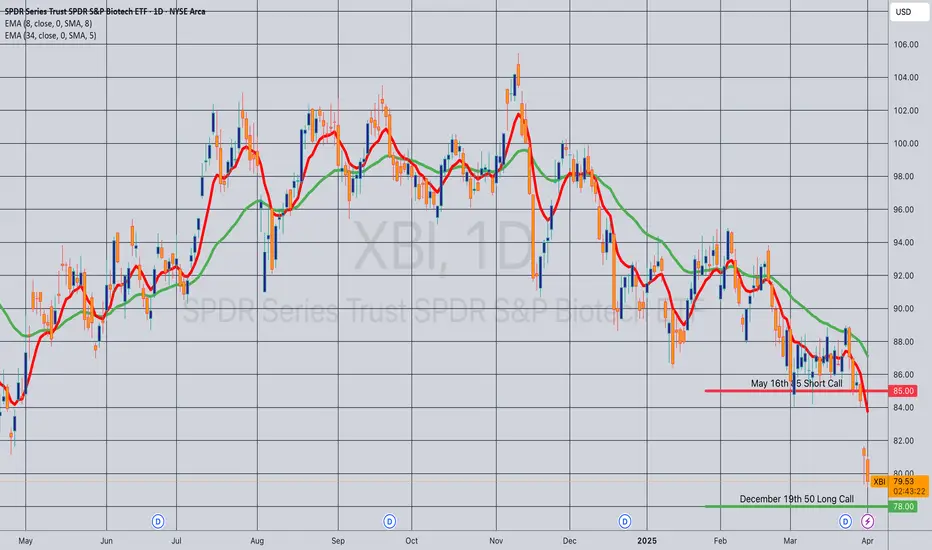
Opening (IRA): XBI May 16th -85C/December 19th 50C LCD*... for a 29.50 debit.
Comments: Adding to my XBI position at or near 52-week lows, buying the back month 90 delta and selling the front month -30 delta that pays for all of the extrinsic in the long. (The 50C is depicted at a higher strike so that it fits on the chart).
Metrics:
Buying Power Effect: 29.50
Max Profit: 5.50
ROC at Max: 18.64%
50% Max: 2.25
ROC at 50% Max: 9.37%
Will generally look to take profit at 50% max and/or roll out short call to reduce downside break even.
* -- Long call diagonal.
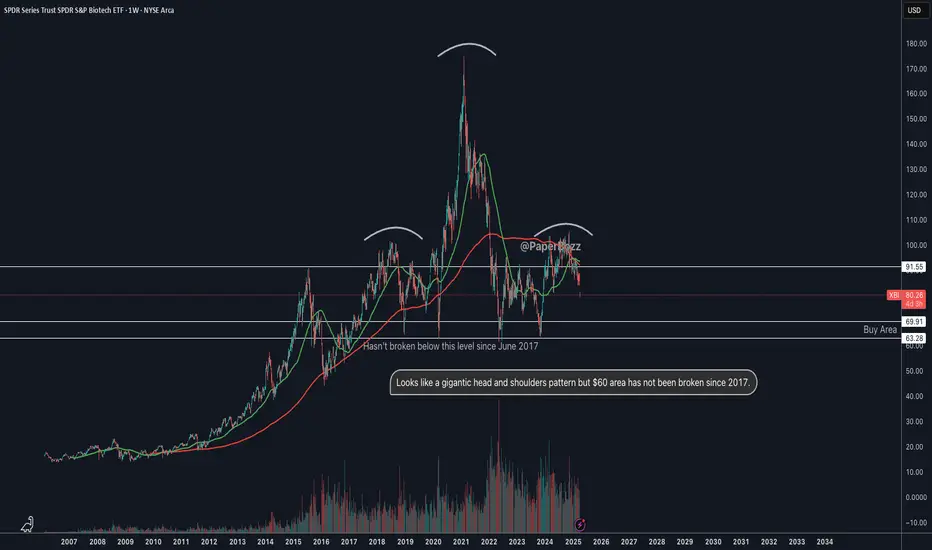
$XBI - Looks scary butAMEX:XBI looks like it is in the process of forming a gigantic head-and-shoulders pattern. However, the stock has not broken below the $60 level since 2017.
Opening (IRA): XBI Sept 19th 60C/April 17th -90C LCD*... for a 26.68 debit.
Comments: Taking a bullish assumption directional shot near 52 week lows, buying the 90 delta back month and selling a front month that pays for all the extrinsic in the long, resulting in a break even that is at or below where the underlying is currently trading. The 60 long call is shown at 80 so that it fits on the chart ... .
Metrics:
Buying Power Effect: 26.68
Break Even: 86.88
Max Profit: 3.32
ROC at Max: 12.44%
50% Max: 1.66
ROC at 50% Max: 6.22%
Delta/Theta: 53.79/3.51
Will generally look to take profit on the setup as a unit at 50% max and/or roll out the short call at 50% max to reduce cost basis/downside break even.
* -- Long Call Diagonal

XBI monthly head and shoulders?Anyone else seeing a head and shoulders pattern in XBI on the monthly?

Opening (IRA): XBI March 21st 85 Covered Call... for an 83.52 debit.
Comments: One of the only red things on my ETF board ... . Selling the -75 delta call against shares to emulate the delta metrics of a 25 delta short put, but with the built-in defense of the short call. Just trying to squeeze in a little more into March while the monthly options contract is in that 35 to 56 DTE window. The ROC %-age isn't what I like to see out of these (2.0% or greater), but, hey, you can't have everything ... .
Metrics:
Buying Power Effect/Break Even: 83.52
Max Profit: 1.48
ROC at Max: 1.77%
50% Max: .74
ROC at 50% Max: .89%

$XBI Starting New Bullish Trend?AMEX:XBI has been range bound (wide range) for a year. Recently it has been in a downtrend as defined by lower highs and lower lows. However, it looks like we now have a recent higher high and (maybe) a higher low. There are still technical challenges like it is under all moving averages. It would look much better once it gets above the shorter-term MAs which are all declining. The MACD is on a slight downward slope as well.
Having pointed all that out, I will be looking at a lower time period chart to get an early entry with a tight stop. If I do take a trade on this, I will post the chart I am looking at. All TBD.
This is my idea, if you like it, please make the trade your own and follow your own trading rules.

Opening (IRA): XBI March 21st 86 Covered Call... for an 84.20 debit.
Comments: Adding to my position at strikes better than what I currently have on, selling the -75 delta call against shares to emulate the delta metrics of a 25 delta short put, but with the built-in defense of the short call.
Metrics:
Buying Power Effect/Break Even: 84.20
Max Profit: 1.80
ROC at Max: 2.14%
50% Max: .90
ROC at 50% Max: 1.07%
Will generally look to take profit at 50% max, add at intervals, assuming I can get in at strikes better than what I currently have on, and/or roll out the short call if my take profit isn't hit.

$LABU upward move coming… Daily pívot point towards a high prob of upside move. 2month falling wedge breakout. Bullish divergence, making higher low. Looks like chance of character.

Opening (IRA): XBI January 17th 92 Covered Call... for a 90.47 debit.
Comments: IVR/IV isn't fantastic here at 11.1/26.3%, but there is some IV skew to take advantage of on the call side -- 31.34% at the 92 call relative to 26.62% at the 92 put.
Selling the -75 delta call against shares to emulate the delta metrics of a 25 delta short put to take advantage of the IV skew and the built-in defense of the short call. From a charting standpoint, the break even sets up nicely with the "RFK, Jr. low" in November.
Metrics:
Buying Power Effect/Break Even: 90.47
Max Profit: 1.53
ROC at Max: 1.69%
50% Max: .77
ROC at 50% Max: .85

Opening (IRA): XBI February 28th 82 Covered Call... for an 80.54 debit.
Comments: Adding to my position at a strike/break even better than what I currently have on. Going with the February 28th, since the March monthly remains someone long in duration.
Metrics:
Buying Power Effect/Break Even: 80.54/share
Max Profit: 1.46
ROC at Max: 1.81%
50% Max: .73
ROC at 50% Max: .92%
Will generally look to take profit at 50% max, roll out short call on take profit test.

Opening (IRA): XBI February 21st 85 Covered Call... for an 83.01 debit.
Comments: Adding at strikes/break evens better than what I currently have on, selling the -75 delta call against shares to emulate the delta metrics of a 25 delta short put, but with the built-in defense of the short call.
Metrics:
Buying Power Effect/Break Even: 83.01/share
Max Profit: 1.99
ROC at Max: 2.40%
50% Max: 1.00
ROC at 50% Max: 1.20%
Will generally look to take profit at 50% max, roll out short call on take profit point test.

Opening (IRA): XBI February 21st 83 Covered Call... for a 81.26 debit.
Comments: Adding at strikes/break evens better than what I currently have on, selling the -75 delta call against stock to emulate the delta metrics of a 25 delta short put with the built-in defense of the short call.
Metrics:
Buying Power Effect/Break Even: 81.26/share
Max Profit: 1.74
ROC at Max: 2.14%
50% Max: .87
ROC at 50% Max: 1.07%
Will generally look to take profit at 50% max.

Opening (IRA): XBI January 17th 89 Covered Call... for an 87.50 debit.
Comments: Adding at strikes/break evens better than what I currently have on ... . The ROC metrics aren't what I generally like to see out of these (2.0% or greater), but it's shorter duration than my usual wheelhouse (45 DTE) ... .
Metrics:
Buying Power Effect/Break Even: 87.50
Max Profit: 1.50
ROC at Max: 1.71%
50% Max: .75
ROC at 50% Max: .86%
Will generally look to take profit at 50% max.

LONG XBII am long AMEX:XBI via $AMEX:LABU. Seasonality is usually good for XBI this time of year and looking at 4h chart its ready to move up.

XBI: Sellers Finally Taking A Chill PillHey, guys. Appreciate everyone tuning in! Wanted to take the opportunity to review AMEX:XBI . I certainly have a disappointing relationship with this one from past attempts to carry the ETF in my portfolio. Now, I tempt fate again. P.S. hope you don't mind the quick sojourn chat about COINBASE:BTCUSD and the strong weekend move there.
I believe there is certainly a short term play higher in XBI. But I also believe it can lead to a really explosive longer term move as well. I suppose, as always, only time will tell. Hope it was helpful to point out this set up at any rate.
Hope you enjoyed the review, and best of luck out there!

$XBI - Big potential in either direction on the monthlyMonthly chart. I see a head and shoulders where we're rounding out the right should right now to the downside with a great put play. However, we are above all VWAPs and EMAs on the monthly with some thin volume profile above. Current month has a bullish candle so there's a chance we negate the H&S and send it higher. If it goes higher, I bet we see $112 and $125 as levels - or around there.

XBI eyes on $99.96 above, 99.12 below: narrow range to breakBiotech tryhing to mount a bounce again.
XBI currently testing key fibs of wave down.
Look for break of range for clues on next move.
$ 99.96 break would be the key bull signal.
$ 99.12 hold would indicate strong bulls here.
$ 98.29 below is a MUST-HOLD and thus SL area.
==========================================
.

XBI ShortMonthly and Weekly Sell signals. Usually double signals are better but if buyers don't resest there should be a nice move.
Pivot 99


Continuation Long XBIMassive Bid absorption this week could propel XBI to highs with the continued momentum. If buying continues in large quantities we could see a new high
