XBI trade ideas


Good R/R for short position in XBI?Technically Speaking
Price is trading right up to the pivot level 68.
Where is the R/R?
The R/R favors the shorts at these levels, in my opinion. I would target the rising trendline noted on the chart. Stop above 73.
If long, you have three options, hold and hope for bigger gains,take profits, or use a trailing stop.
As always, trade your plan and execute.

Biotech may be a good buy, or waiting election USThis may be a good time to add 1/3 to 1/2 of the total position, save some for 200ma if we go down there

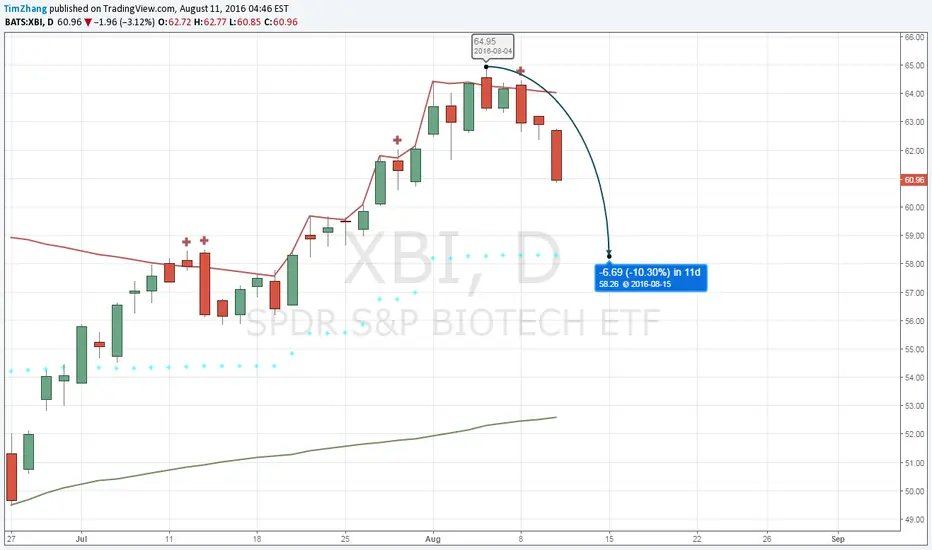
LABU - A possible bottomYesterday we had a capitulation type of volume in XBI, so I think we are very close to the bottom, or maybe we had it yesterday.
I still think that the 06.29-06.30 gap is a runaway gap - which will never be filled- and yesterday we almost exactly tested back the top of the gap. And today we couldn't fall anymore we are just bouncing from the gap.
So I think entering here is a low risk trade if someone set a stop below yesterday's low.
If we break below yesterday's low and enter into the gap we are going to fill that and we are getting very close to the 49$ level. If we break below 49$ I'm quite sure that we are making lower low in XBI so the line in the sand is the yesterday low for me.
If we take that out I'M not interested in XBI for a while.
Indicators
MACD is turning up and might want to cross over
RSI left overbought - in the past it was a sign of the next leg up.
We are charting in XBI so you have to trade based on this when buying LABU.
The 3x ETF chart (LABU) is not good for charting.
LONG XBI 54.70 $
STOP 52.80 $
LONG LABU 26.90$
STOP when XBI breaks below 52.80$


Cypher Pattern CompletionDaily (almost) cypher pattern is looking to complete which would coincide with the follow through of the bearish bat formation posted a few weeks ago. I say almost cypher as point B is a bit shallow. Will be watching closely

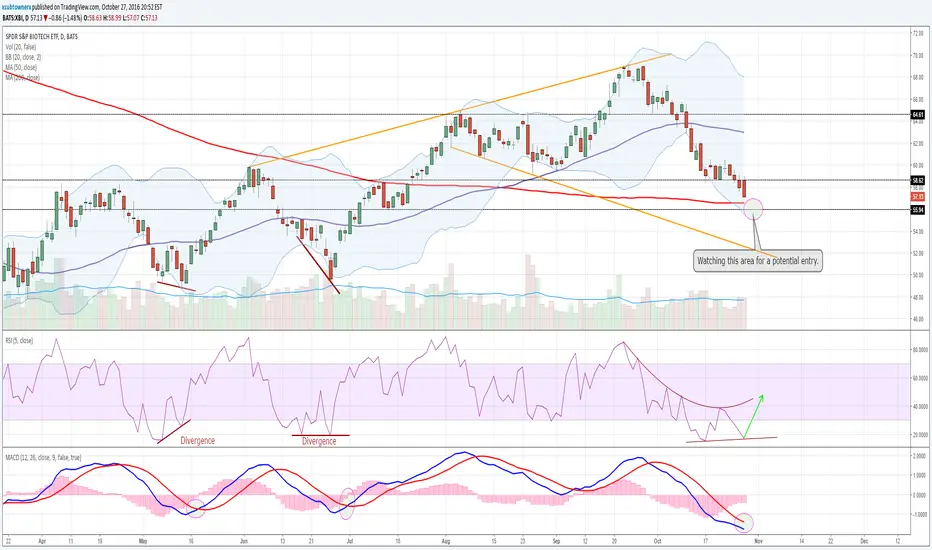
XBI Speculative Long PlayWe are finally starting to see some bullish indicators on the daily for XBI. Of course with bio, the swings are long and hard to predict bottoms, so this idea/play is pure speculative. Looking back we can see similar RSI divergence signals and MACD crossovers as to what we can "potentially" see here in the next couple of days.
Any bounce off the 55.95-ish area would be pretty bullish for a short term long swing, using possibly LABU. It'll be interesting to see what happens in the next couple of days...
XBI is running into head & shoulder pattern lets form the Right shoulder, it is good opportunity to scalp a long to 64.24 which happens to be in the clones level. Watch closely to see there is no further decline over neckline.

XBI Short Term Down Trend ContinuesDespite the gap up today, the short term downtrend is still in-play. Key support/resistance are converging which suggests a strong move either way. The descending triangle pattern seen here has a heavily has bearish probability. My 2 main trend indicators are EMA (13/48) and PPO (12,26,40), which are both bearish on the daily time frame.

LABU - Rally must go onIt was a bit early for this pullback. I was quite sure that the oil rally will push up S&P to new highs - it didn't happen though.
It's too early for LABU and XBI to print any scary correction now. We are tagging the 20 EMA in XBI and that might be the end of this pullback both in LABU and XBI.
If oil continues its run - and I think it will - that will be oil on S&P's fire.
That could give a push to the biotech sector as well.
Hopefully Hillary doesn't attack biotech again in the following weeks so we can finish this daily cycle with great gains.


XBI Daily - Time to Short Bio?There's nothing I like more than spotting similar patterns when looking at charts. History does tend to repeat itself. So what we can see here is a pretty standard MACD divergence forming right now, and what looks like a copy paste of what happened a few months back. I'm short until the bottom trendline. Weekly chart not looking good either, but we'll look at that Friday. We could see a pretty "YUGE" correction next week for XBI.


Breaking down Retest in 60's - Current support at 50 day SMAlooks ready to retest 60's where there is a large gap

XBI Completing Bearish Bat?Looks to be forming a bearish bat pattern. Indicators looking a little toppy, looking for more bearish confirmation before diving in.