XHB ! US housing market Burst- Upcoming Recession-BTC 100K+I'm looking at XHB weekly timeframe and comparing 2006-2009 US housing market with current situation. On 17 July 2006 XHB bounced 38% then dumped and lost previous swing low/ key support /28-30$ level/ on 23 July 2007/371 days/. When XHB lost key support SPX made first top and second top was 3 months later with bearish divergence, after which S&P dumped 57% and stayed in a bear market 511-595 days. After the bursting of the U.S. housing bubble US great recession started from December 2007 to June 2009. XHB dumped 73% and bottomed at 8$ in 2009. I think the current situation is the same and the same scenario will play out if XHB loses previous swing low and key support/50-52$/. It has already dumped and lost key trendline 60-61$ then pumped 32%. I putted alarm at 50-52$ zone and waiting for break down in coming months, I history repeats the same way, XHB will break down in Q2-2023 /approximately in April-June 2023/ and 140 days later a big recession starts. I think at the same time SPX and BTC will top as well. But before that my best case and most bullish scenario for BTC is new ATH and even 120-145K top target. I'm sure BTC has already topped at 17.5K on 18.06.2022 based on my analysis. You can check them looking at bellow attached files. Later I will post my other scenarios for BTC.
XHB trade ideas

Housing correlations - building, existing, selling.Simple chart to look at the relation between hew home builds, a broad housing ETF and a mortgage lender.
It demonstrates that they all have a strong correlation and that mortgage company performance is a leading indicator of housing market performance and that new build housing stocks are a leading indicator for the housing market in general.

$XHB ~ Correction still in progress...Just as the real estate sector, expect homebuilders continue to correct the same. Nice pull back for a wave 2 will present a amazing opportunity as we move forward in the decade. Inventory is very low which is good since rates are moving higher.

XHB Accumulating on support Been bearish on the markets for a few months now but it looks like XHB should get a slight rebound off support here.

The Flood?I wonder if we are about to witness a market "correction" of biblical proportions, right in time for Easter.
So far this decade, all bearish bets have basically been slaughtered, but fundamentally, this is still a grand delusion, likely the greatest financial heist in the history of all our civilizations.

4/24/22 XHB SPDR Series Trust Homebuilders ETF ( AMEX:XHB )
Sector: Miscellaneous (Investment Trusts/Mutual Funds)
Market Capitalization: $--
Current Price: $61.34
Breakdown price: $60.00
Sell Zone (Top/Bottom Range): $61.40-$68.80 (1st)
Price Target: $51.40-$49.40 (1st)
Estimated Duration to Target: 107-110d (1st)
Contract of Interest: $XHB 9/16/22 60p
Trade price as of publish date: $4.10/contract

Home Builders SHORT Home builders looking like junk.
Trend is lower.
Look for quality companies, avoid cyclicals.

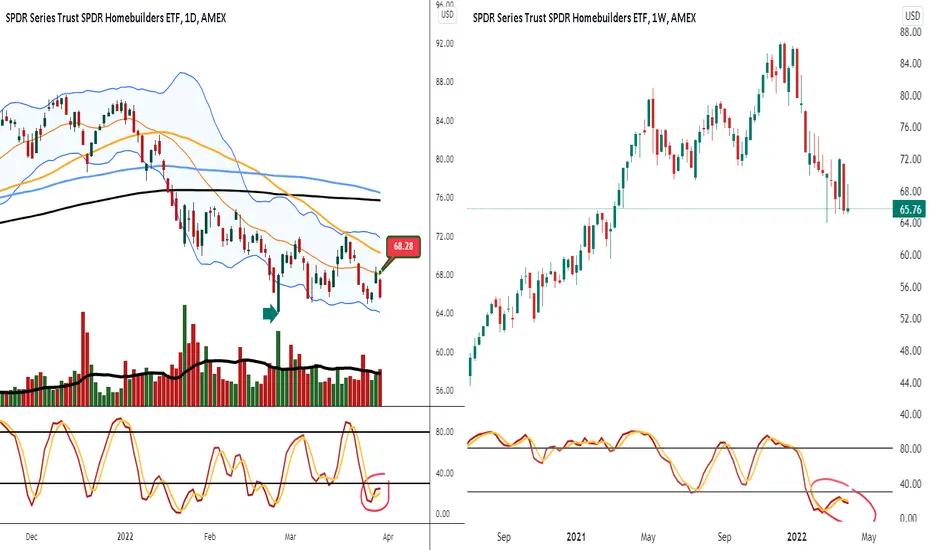
UPDATE XHB SHRT SWITCH FROM SWING SHRT TO POSITION SHRT 68.28I added XLB short. I was using the daily stoch as swing trade short.
Know I am moving from the daily chart over to the weekly chart for longer term position
The weekly stoch under 30% and crossed down and u have lower highs
target 26. Look daily vol more selling
I have order really load up breaks 64 green arrow
More Weakness SeenHomebuilder ETF could come under more selling pressure with price drop toward $50. Will stay away for at least until 3rd QTR.

I am short XHB @ 66.77Daily stoch heading down looking for housing continue drop with high rates. She breaks 64 she will drop. Look vol not bad
Look weekly heading down

Interesting short idea for rising ratesThis can be a good short with all the discussions about rising rates. Chart is setting up a bear flag on a crucial level. When this gives out there isnt much support underneath. Taking a position in puts.

Housing Bears Watching ~$74.75This sideways chop/channel has been keeping both the bulls and bears honest for a while now. I am leaning on the GREEN and ORANGE dotted lines (lookback periods) to maintain my bearish bias.
There are four sets of support and resistance levels that are displayed by Aspen Trading’s S/R Analysis Tool. Each one is unique to a specified period of time that we then display directly on the chart. The levels are classified as follows
GREEN: displays 2 solid lines (upper/lower)
ORANGE: displays 2 lines (upper/lower)
RED: displays 2 lines (upper/lower)
PURPLE: displays 2 lines (upper/lower)
IMPORTANT: These lines will change/adjust until the end of the specified observation period is complete.
Once the observation period is complete, that range will then be displayed on the chart as a set of dotted lines that is shaded in to serve as a reference point for traders to know the key levels from the prior lookback period. This can often be very helpful.
What’s the distinction between the 4 color levels?
Essentially think of these levels on a rising scale of importance. While GREEN levels are certainly key, they do not hold the same level of significance as the PURPLE levels.

EverGrande Real-estate situation in China = Black Swan Event?Will the EverGrande Real-estate situation in China be the catalyst that pops our real estate bubble and slow down our homebuilder industry?
This was last year, when they listed their stock to the HK market and scammed retail money. Now they are out of cash again, and their bonds are worth less than 30% on the dollar.
If this thing collapse, it could be China's version of the Lehman Collapse.
"
The world’s most indebted developer has warned Chinese officials it faces a potential default that could roil the nation’s $50 trillion financial system unless regulators approve the company’s long-delayed stock exchange listing. Shares and bonds fell in volatile trading.
China Evergrande Group mapped out the scenario in an Aug. 24 letter to the Guangdong government seen by Bloomberg, in which the company sought support for a restructuring proposal needed to secure the listing and avert a cash crunch.
Some of Evergrande’s biggest strategic investors have the right to demand their money back if the company fails to win approval for a backdoor listing on the Shenzhen stock exchange by Jan. 31. If investors refuse to extend the deadline, Evergrande will need to repay as much as 130 billion yuan ($19 billion), equivalent to 92% of its cash and cash equivalents."

Housing Market Correction Housing market is looking pretty toppy. Would suggest holding off on buying a home for a few months.. Supply is greatly starting to outpace demand.


selling ralliesthis complex is clamped by breakevens that'll tighten their margins...on what I consider usually shoddy builds to begin with.
In other news, van dwelling on the rise...

HomeBuilder Stocks going to the MoonIt all depends on who can acquire and improve land the fastest. Where else are you gonna buy a house when 30 YR is sub 3%, since nobody but builders want to sell.

Will XHB outperform SPX in Winter 2021?XHB has underperformed SPX since Nov and may continue to year-end.
Is it an opportunity to pick high quality stocks in this group?

XHB-1.0*ITB $XHB(HomeBuilders SPDR) vs. $ITB(HomeConstr Ishares)Quantamental Tools for Proprietary and Retail Investors.
Statistical Arbitrage Opportunities Delivered to Your Inbox.
QuantChart. io
Long 100 $XHB
Short 100 $ITB
Mean Reversion Time: 8 Trading Days

V BottomPrice hasdipped through the bottom trendline of the risng wedge pattern. The bottom trendling narrows and ends at 51.93 This pattern is often bearish but is not valid unless bottom trendline is brokencausing a fairly deep pull back. A RW can be a very long term pattern. A strong stock can actually break up and out of this pattern..or fall through bottom trendline but only briefly. It just depends but all in all, a RW is bearish
Not a V Cup as the line I drew is above the long entry level
I drew that line to show possible support
ITB has taken a dip out of it's RW already as well. ITB is another option which is similar but the holdings are very different. Take a look at both as they are both at basically the same price range right now with similar targets. ITB has LOW, HD, BLD, PHM, DHI, NVR, TOL, MAS, LEN and SHW among it's top 10 holdings
Top 10 Holdings
WHR - Whirlpool Corp4.29%
DHI - D.R. Horton Inc4.27%
LEN - Lennar Corp4.25%
TREX - Trex Co Inc4.23%
CARR - Carrier Global Corp Ordinary Shares4.21%
TT - Trane Technologies PLC4.17%
LOW - Lowe's Companies Inc4.13%
PHM - PulteGroup Inc4.12%
MHK - Mohawk Industries Inc4.05%
HD - The Home Depot Inc4.05%
Not a recommendation


$XHB Homebuilders ETF Nearing Breakout - 10% Upside Near Term$XHB Homebuilders ETF - Nearing Breakout
Level to watch is $49.22 - a close today above this level is bullish for the near term.
Target: $54-$56 by early September (assumes close today above resistance)
