XHB Double Bottom/Channel Setting Up$XHB looking like a large double bottom formation. See if it breaks neckline over next few months for confirmation.
XHB trade ideas

#XHB: Sell Breakout!Homebuilders hit a top and formed a double top after correcting a bear impulse leg now price is hitting sideways support so looks like there could be a short set up here as a new impulse into the lows it is worth keeping an eye on this one
For more information in joining my professional signals group or professional online trading tuition, Message me directly on Trading view or email me with the email address on my Trading view profile page. UK residents are eligible for considerable discounts. Offer ends this weekend!
Twitter: Tomkillick1
Email: T.killick182@gmail.com
Skype: Tom.killick182

#XHB: Bulls Around, Looking For Buy Setup!Bulls are around, could be a set up next week here so we should keep an eye on this one.
For more information in joining my professional signals group or professional online trading tuition, Message me directly on Trading view or email me with the email address on my Trading view profile page
Twitter: Tomkillick1
Email: T.killick182@gmail.com
Skype: Tom.killick182
Best regards,
Tom


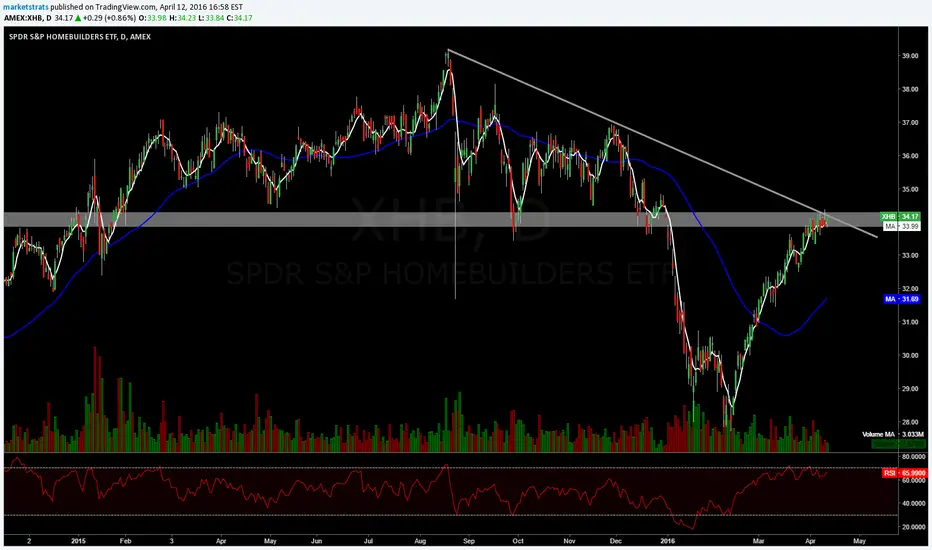
Entered Homebuilders ETF today anticipating the breakoutThis is clearly ready to pop with a key horizontal level and diagonal trendline being tested. Above rising 5 day MA. Placing a stop under rectangle.

Homebuilders ETF - XHB - Rally back to maximum resistance level1. Overbought on CCI
2. Trend Indicator is in a downtrend using 2 month low in RgMov
3. Maximum volume level at $36.50 is maximum resistance here.
4. Large distribution zone could be in place if below $36.50
Time will tell.
It looks like a good setup here. Sell short if down on the day only and more if below Friday's low.
Tim 1:15PM Sunday 10/11/2015

XHB-Homebuilders: Weakness At Key Levels, Waiting For ShortsTraders
Clear weakness is seen here
-Lower low to an important resistance level, (Sideways as well as straight resistance levels, creating an action level)
-Sideways and straight resistance are having an impact on the stocks price.
-We are at 61.8 retrace of the corrective leg impulse, looking very nice for some downside
-Converging major MA's - Converging moving averages could create a death cross, (Already seen intermediate MA crossings occurs)
-Hidden bearish divergence on Stochastic.
Best of luck
Tom


XHB $35.75: Consolidates above a 2-month range support at 35.01XHB has been consolidating within a 2-month range between March’s 35.01 low and the 37.31 YTD peak (March 31, 2015). While the 35.01 range support holds dips, back above the 36.59 resistance (April 16, 2015 high) would suggest basing and offer scope for further bullish momentum towards 37.31. Clearance above the latter is needed to complete the 2-month long consolidation and extend the uptrend trend higher. However, if bears manage to break below the key 35.01 support area (which houses the 89 day moving average) would signal near term topping and expose 33.73 (200 day moving average0.
Outlook:
Short term: Neutral
Long term: Bullish while the 200 day moving average holds


XHB LONGXHB breaking out yesterday taking out a previous double top area and the Fractal marked on the chart.
Homebuilders should remain strong going into spring season. I am long XHB

False breakout...Housing SUCKS. This is the SLOW season coming up, to make it worse. New housing apps down to lowest level in forever, everything about housing SUCKS. GREAT SHORT HERE.
Update 11/21: I was a little early on this short! I was happy to buy a few cheap $33.5 weekly puts for next week. I typically don't like to buy options at the end of the week to carry into the next, but, this was one hell of a candlestick up, that hardly seems sustainable. But then again, I never thought the XHB would make it this far. This whole thing is being propped up with HFT/ALGO BS because the whole market s rigged. Look at all the mess: FOREX Scandel, Libor scandal, now the latest commodity scandel, Madoff, JP Morgan and all these banker deaths that seem all too conspicuous. ALL these unusual banker suicides 48 of them in the past year and a half, and now on last night who slit his own throat and wrists? Who does that to themselves? Ridiculous. Many of them at JP Morgan, some who knew each other, some in IT Programming. Probably knew too much. Did you know these institutions carry insurance policies on their employees that are classified? They have a motive to see them killed if they get in the way. THEY COLLECT. I'm not conspiratorial, it's just the way this screwed up place we call planet earth has become. Pretty sickening how greedy and selfish we can be at times. Anyway, this wasn't meant to be a diatribe. There are so many banking scandals it's sick. And none of them go to jail. They to big to fail, and to big to jail.
Update: Wow, who would have thought the ECB would finally juice the market, and China drops rates. Next up... does the FED juice the market to keep up? I am finally short XHB at 33.50. I hope there are no more surprises!

Housing is doing so poorly, this latest surge upward is a SELLHome prices are falling, less and less applications for homes, and rising interest rates... nothing is going well for the housing hangover...


XHB - Jackson hole playHousing sector has had an excellent week but may be impacted by the words of our esteemed fed chair when speaking at the Jackson Hole symposium (9.10am kick off). A move over $31.75 would also represent a break of the 200MA. Bough call potential

SPDR SPDR S&P Homebuilders have started to roll lower. MACD already negative and we are below MA65 and MA89. RSI also looks bearish.

$XHB hold above $30I wrote back on 5/4 on my blog that "I'm standing by XHB" that I thought the negativity around housing was excessive and higher prices would eventually come our way. Some of the "smart" money on Wall Street was decisively negative. Among the stories predicting the fall in stock prices of the home builders included this one from Friday the 23rd.
Big investors are betting against housing (on marketwatch.com)
For now it looks like they may be on the wrong side of the trade. Two primary reasons: one fundamental and one technical.
On the fundamentals housing construction numbers from the Commerce Department were bullish as reported by Reuters:
Housing stocks rallied for a second day after data from the Commerce Department showed sales of new U.S. single-family homes rose more than expected in April and the supply of houses on the market hit a 3-1/2 year high. A day ago, another report showed existing home sales rebounded in April.
While demand is still healthy the chart indicated that the market is still bullish on housing. After printing generally lower prices for two months price hit $30 (the line of defense I cited in my post on May 4th), formed a "spinning top" indicating indecision and then rebounded hard this week.

Housing - S&P 500 DivergenceThe extreme divergence between housing and $SPY recently is either a sign that housing with explode higher to catch up soon or that the S&P will sink to fall in line with housing. You decide.

Homebuilders: Rising Trend Line Broken After Cup w/HandleFailure. $ITB $IYR $LEN $RYL $PHM $TOL $DHI

XHB Bearish ButterflyWe could see it retest the $32-$33 area before fully reversing. But a Bearish Butterfly that finished at a 61.8% of the entire chart is a good bet to place on the downside. On a fundamental side, if interest rates rise we will see these guys get hit hard.

