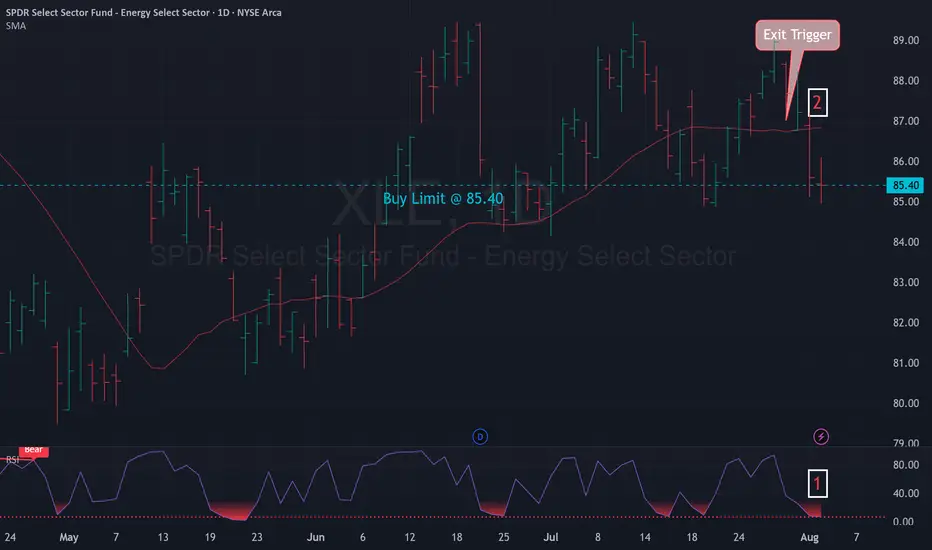
Mean Reversion Trade: XLE1. RSI in oversold region
2. Price likely to rebound back the the mean
Trade Rules:
Entry Trigger - RSI has cross below oversold region, enter limit buy at close price
Exit Trigger - Close at market when close price cross above exit trigger (Red line)
Key stats
About SPDR Select Sector Fund - Energy Select Sector
Home page
Inception date
Dec 16, 1998
Structure
Open-Ended Fund
Replication method
Physical
Dividend treatment
Distributes
Distribution tax treatment
Qualified dividends
Income tax type
Capital Gains
Max ST capital gains rate
39.60%
Max LT capital gains rate
20.00%
Primary advisor
SSgA Funds Management, Inc.
Distributor
ALPS Distributors, Inc.
XLE offers liquid exposure to a market-like basket of US energy firms. Market-like in the context of the energy sector means concentrated exposure to the giants in the industry, including companies in the oil, gas and consumable fuels, and energy equipment and services industries as identified by GICS. XLE pulls its stocks from the S&P 500 rather than the total market, so its portfolio mainly favors large-caps. Holdings are weighted by market cap, subject to a capping methodology that ensures no single security exceeds 25% at each quarterly rebalance.
Related funds
Classification
What's in the fund
Exposure type
Energy Minerals
Industrial Services
Stock breakdown by region
Top 10 holdings
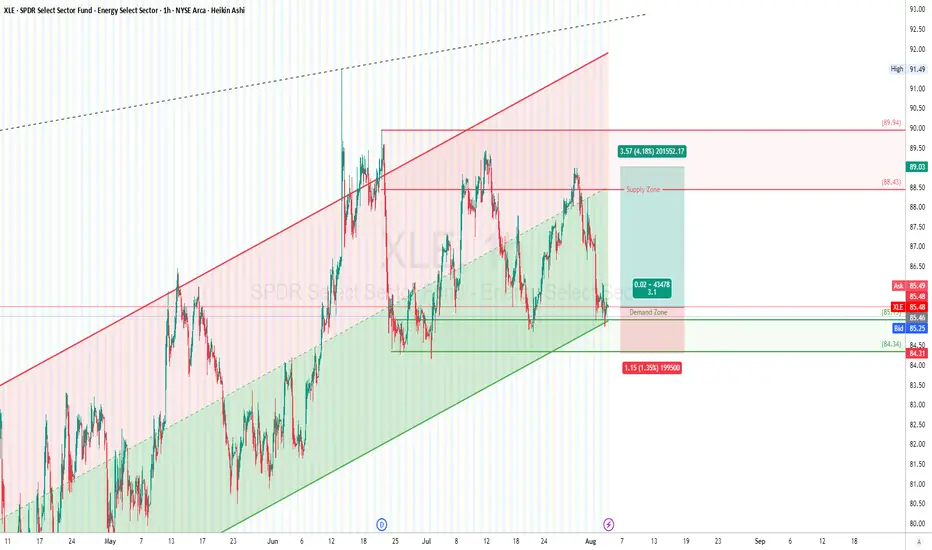
XLE 1H Long Setup🔥 **XLE 1H Long Setup** — SPDR Energy Sector ETF
*Powered by Dubai Traders Hub*
“Energy bulls just tapped the gas at channel support — and the wick says it all. High-prob bounce off demand, riding it up to where the bears got clapped last time. Classic range-to-range flow. Don't sleep on it.”
###
Energy printing fresh highs within weeksHere's a better chart than the one shared in October, showing that energy has been consolidating above an upward sloping triangle formation, over 900 days in the making .
With just under 4% remaining to reach prior highs set in April, fresh highs could be just weeks away. Looking at the height of

Energy stocks poised for fresh ATHEnergy stocks (XLE) have been in a clear ascending triangle for some months now on the weekly chart. There was a false breakout not too long back, but the pattern held up after breaking down and price is again pushing up against resistance at the top of the triangle.
Having recently posted a massiv

XLE Setting Up For a Run? XLE is looking to create a new run? Possibly with that inverted hammer that we see where sellers failed. It just made a huge gap down that will need to be filled. I could see it testing the $83.41 support and resistance shelf and retracing back to the upside to close the gaps back through $86.41.

Energy ETF Is Still Below Last Decade’s HighsThe SPDR Select Sector Energy ETF has been plagued by some long-term negatives, but some traders may see those issues becoming more positive.
Today’s idea uses two-week candles to give a long-term view. The first key pattern is the 2023 low of $75.36, which XLE tested and held during last month’s t

Energy sector bearish amid high interest rates + trade warXLE
Weekly
Volume spike + Reversal Candle
Continuation candle didn't break the high of the reversal candle's high
Last weekly candle is week
Most probable scenario is a test of the 74.5 weekly low level
Daily
Bear flag with 20 daily EMA acting as resistance
Momentum bearish:
High US interest rat

XLE eyes on $83.30: Genesis fib that held Tariff Relief bounce XLE testing a key Genesis fib again at $83.30
This fib stopped the massive tariff Relief bounce.
If oil keeps dropping, this would be a good short.

Will the US Energy Sector Outperform the Overall US Market📈 The US Energy Sector has completed a textbook corrective pattern, ideally a fourth wave.
⏺️ If the 74.49 low holds (-7% decline from today), this sector has the potential to gain at least 23% over the coming months.
🟠 A breach of 74.49 invalidates this outlook.

Support is near but...Looks like a weekly reversal is on it's way.
Notice the 2 false breakouts and the double top.
Also notice the strong break out from the Triangle pattern.
What's next for Energy?

See all ideas
Summarizing what the indicators are suggesting.
Oscillators
Neutral
SellBuy
Strong sellStrong buy
Strong sellSellNeutralBuyStrong buy
Oscillators
Neutral
SellBuy
Strong sellStrong buy
Strong sellSellNeutralBuyStrong buy
Summary
Neutral
SellBuy
Strong sellStrong buy
Strong sellSellNeutralBuyStrong buy
Summary
Neutral
SellBuy
Strong sellStrong buy
Strong sellSellNeutralBuyStrong buy
Summary
Neutral
SellBuy
Strong sellStrong buy
Strong sellSellNeutralBuyStrong buy
Moving Averages
Neutral
SellBuy
Strong sellStrong buy
Strong sellSellNeutralBuyStrong buy
Moving Averages
Neutral
SellBuy
Strong sellStrong buy
Strong sellSellNeutralBuyStrong buy
Displays a symbol's price movements over previous years to identify recurring trends.
Frequently Asked Questions
An exchange-traded fund (ETF) is a collection of assets (stocks, bonds, commodities, etc.) that track an underlying index and can be bought on an exchange like individual stocks.
XLE trades at 84.72 USD today, its price has fallen −0.51% in the past 24 hours. Track more dynamics on XLE price chart.
XLE net asset value is 84.69 today — it's fallen 2.71% over the past month. NAV represents the total value of the fund's assets less liabilities and serves as a gauge of the fund's performance.
XLE assets under management is 26.56 B USD. AUM is an important metric as it reflects the fund's size and can serve as a gauge of how successful the fund is in attracting investors, which, in its turn, can influence decision-making.
XLE price has fallen by −1.65% over the last month, and its yearly performance shows a −2.36% decrease. See more dynamics on XLE price chart.
NAV returns, another gauge of an ETF dynamics, have fallen by −2.71% over the last month, showed a 6.01% increase in three-month performance and has increased by 1.06% in a year.
NAV returns, another gauge of an ETF dynamics, have fallen by −2.71% over the last month, showed a 6.01% increase in three-month performance and has increased by 1.06% in a year.
XLE fund flows account for −9.33 B USD (1 year). Many traders use this metric to get insight into investors' sentiment and evaluate whether it's time to buy or sell the fund.
Since ETFs work like an individual stock, they can be bought and sold on exchanges (e.g. NASDAQ, NYSE, EURONEXT). As it happens with stocks, you need to select a brokerage to access trading. Explore our list of available brokers to find the one to help execute your strategies. Don't forget to do your research before getting to trading. Explore ETFs metrics in our ETF screener to find a reliable opportunity.
XLE invests in stocks. See more details in our Analysis section.
XLE expense ratio is 0.09%. It's an important metric for helping traders understand the fund's operating costs relative to assets and how expensive it would be to hold the fund.
No, XLE isn't leveraged, meaning it doesn't use borrowings or financial derivatives to magnify the performance of the underlying assets or index it follows.
In some ways, ETFs are safe investments, but in a broader sense, they're not safer than any other asset, so it's crucial to analyze a fund before investing. But if your research gives a vague answer, you can always refer to technical analysis.
Today, XLE technical analysis shows the sell rating and its 1-week rating is sell. Since market conditions are prone to changes, it's worth looking a bit further into the future — according to the 1-month rating XLE shows the neutral signal. See more of XLE technicals for a more comprehensive analysis.
Today, XLE technical analysis shows the sell rating and its 1-week rating is sell. Since market conditions are prone to changes, it's worth looking a bit further into the future — according to the 1-month rating XLE shows the neutral signal. See more of XLE technicals for a more comprehensive analysis.
Yes, XLE pays dividends to its holders with the dividend yield of 3.35%.
XLE trades at a premium (0.03%).
Premium/discount to NAV expresses the difference between the ETF’s price and its NAV value. A positive percentage indicates a premium, meaning the ETF trades at a higher price than the calculated NAV. Conversely, a negative percentage indicates a discount, suggesting the ETF trades at a lower price than NAV.
Premium/discount to NAV expresses the difference between the ETF’s price and its NAV value. A positive percentage indicates a premium, meaning the ETF trades at a higher price than the calculated NAV. Conversely, a negative percentage indicates a discount, suggesting the ETF trades at a lower price than NAV.
XLE shares are issued by State Street Corp.
XLE follows the S&P Energy Select Sector. ETFs usually track some benchmark seeking to replicate its performance and guide asset selection and objectives.
The fund started trading on Dec 16, 1998.
The fund's management style is passive, meaning it's aiming to replicate the performance of the underlying index by holding assets in the same proportions as the index. The goal is to match the index's returns.