OPENING: XLE AUGUST 21ST 32/43 SHORT STRANGLE... for a 1.56/contract credit.
Notes: Camped out at the 20 delta with break evens at 30.44/44.56. Look to manage at side approaching worthless or break even test ... .
XLE trade ideas


XLE ENERGY SECTOR - bouncing from Channel lowsAMEX:XLE is seen to bounce off channel lows & wedge breakout.

35 next targetGot burned on my call options pretty good. Waiting for it to hit 35 before getting back in. Virus cases spiking is forcing this thing down again. Not exactly sure where the bottom is yet, but i am thinking 35 has some good support. If we go up from here i need to see it break to 39 before i feel good about going long..
No position right now.

Energy SetupVery simple TA setup with a 4 hour chart on XLE breaking out of a downward wedge pattern. MACD divergence + crossover of signal along with Psar trigger.

Bullish ButterflyHarmonic patter playing out pretty well here.
Markets still so i am not sure how long this lasts. Oil up and CVX up so XLE follows. In weekly Call options now.

Below Gap FilledShould be able to go long from here. Had to dump my previous calls. Getting back in here.
RSI and MFL oversold. Hoping for a reversal here.

XLE HarmonicLooking like a nice little harmonic pattern here. Lots of room for growth with RSI and MFl on the low side, although still not oversold..
Targeting gaps at 42, and 45 above. In calls right now, looking to dump these when we get to 41/41.5 for some healthy gains.

XLE Long CallsAs noted today by NASDAQ XLE has seen " a $238.6 million dollar inflow -- that's a 2.2% increase week over week in outstanding units" which will lead to major upside movement on XLE.

XLE and CVX need to catch upLooking at USOIL up 3% while XLE and CVX still not reacting with it.
Prices have been moving together pretty well until recently. Energy Markets still nervous about second wave closings i think..
Hoping for some gains on XLE this week. In the red on my call options after things were looking pretty good on Friday. still have some time this week to make up on them.

Energy Stocks Near End of Monster QuarterEnergy is the leading sector this quarter by a wide margin. SPDR Energy ETF was up 38 percent since the end of March through Thursday’s close. That’s 7 percentage points ahead of the No. 2 consumer-discretionary fund . This creates the potential for some positive window dressing with just eight sessions remaining in the second quarter.
There are also fundamental and technical catalysts. The fundamentals are fairly clear: The global economy is reopening. Oil demand is rebounding but supplies are tight. OPEC+ is reining in non-compliant countries like Iraq and Kazakhstan. Meanwhile, domestic drilling has fallen off a cliff. Did you know that the Baker Hughes rig count (a proxy for U.S. production) has hit record lows for the last six weeks?
As usual, oil is a boom-and-bust industry. It just went through a major bust, which may create the potential for a boom.
Technically, XLE is parked at the top of a bullish ascending triangle that it broke in early June. It’s also been fighting resistance at its 100-day simple moving average (SMA). Meanwhile, the 50-day SMA has turned higher and is approaching from the downside. This resembles the pattern on the S&P 500 a month ago before it continued upward. (See below.)
XLE had a tight consolidation pattern around $54 before the bottom fell out in February. Traders may want to view that as an upside target and use the 50-day moving average for risk management.

XLEJumped into some weekly calls yesterday. Took a nice bounce off the .618 fib line.
Next target is 42 stop losses at 39
Technical Indicators pointing up


XLE Prepare to long, analysis of conformation entryExisting Condition:
1. Downtrend line was broken by breakaway Gap (G1). Start a new trend.
2. Gap Up above SMA50
3. double bottom reversal pattern confirmed Weekly demand zone in 11/28/2003;
Use Fib number + simple moving average (SMA) + demand zone (DZ) to verify entry point:
1. 0.382 retracement, DZ1, If price raises above 29 (SMA8)
or
2. 0.5 retracement, DZ2, If price drops below 27.1, and back to above 27.2
or
3. 0.618 retracement, DZ3, If price drops below 26.1, and back to above 26.2
or
4. G2: Gap UP above (SMA50) 29.3, market buy at open.
This is the most strong signal. (See the result after G1 Gap)
The target Size is based on the entry point:
DZ1 to SZ1; DZ2 to SZ2; DZ3 to SZ3;
According to this image, I would long calls of XLE/XOP/ERX, buy PUT of ERY;
I will create another trading plan with detailed Stop/Entry/Target (S.E.T) when one of these conditions could be triggered.


Xle 4 hr chart Just a quick look. Ascending triangle perhaps failure is near. Or breakout. It seems to be breakout but we will see which comes first. Short biased


Doing a little consolidation against the resistanceLooking nice. 10 is over 20 and 20 is over 50, and consolidating between fibs. I believe there should be some upward movement coming.

XLE: Will Energy ETF Fill the Gap?What a difference a month makes! At this time in April, crude oil was in negative territory as the market literally paid you to take barrels away. Now it's rebounded sharply as the economy reopens. On top of that, Memorial Day weekend is coming. Even if coronavirus hurts some travel demand, summer driving season is still around the corner.
That brings us back to the energy sector, which is has spent the last three weeks consolidating. The SPDR Energy ETF held roughly $36 last week. That area marked the highs on March 10 and April 9. In other words, old resistance has become new support.
The next chart feature to watch is XLE’s bearish gap from March 9. If it starts to fill that space, buyers may look for a continued push toward at least $42. That price zone also marks the 50 percent retracement of its decline in 2020.
Overall the move in energy is based on seasonality and a lot of economic drivers. Charts alone may not capture its potential to rebound because the market could also face a macro sentiment shift toward beaten-down cyclicals and away from growth stocks – at least for a few weeks.
If that’s the case, energy could be the top beneficiary – along with small caps, financials and industrials. Within energy, traders with the time may want to take a wider view toward refineries and oil-field service providers.


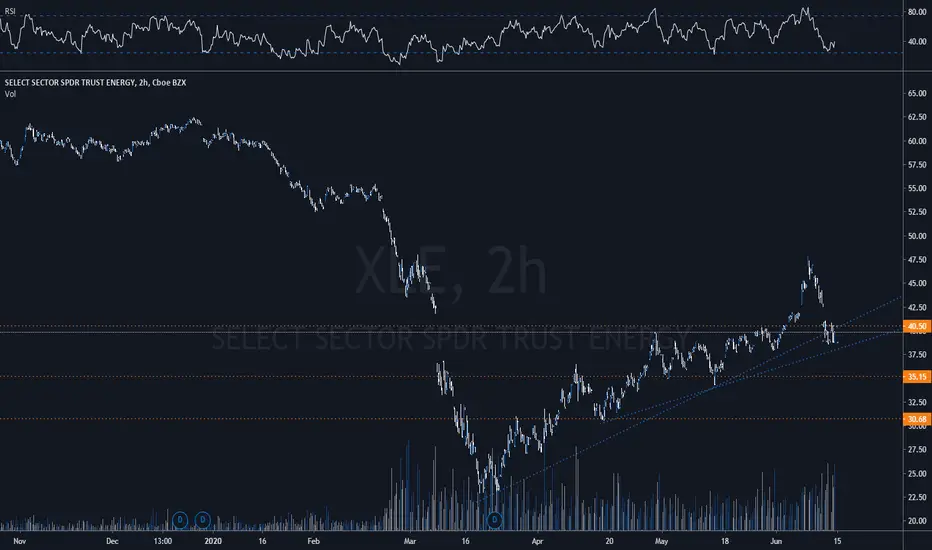
ENERGY SELECT SECTOR SPDR ETF ( $XLE 1D) the cup is full Everyone is well aware that the current state of the world economy is dire.
In my previous analysis I was following the price of WTI and USOIL (link below) but due to the MAY contract debacle the charts are now trash.
So, now to monitor the advancement of the recovery I will now use the Energy sector ETF XLE. It will not be a leading indicator as a transportation index would, but it can be a good indication of the overall economic activity or expectations.
The recent “crash” is what’s look like capitulation (high spread on high volumes). It could take time to recover. Maybe months.
On a daily time-frame however I identify a pseudo cup and handle pattern. Even if it’s not a full reversal on higher time-frames it can lead to a good swing trade.
The price is now retesting the neckline of the pattern ( 35.90) as a support, so it is a good entry point and a good way to manage risk.
Target 41.60 to close the gap then 47.41 last resistance.
The price made a double bottom several weeks ago.
Bullish div RSI
Let us see how all this will turn out.
As time goes by, I will keep you updated on the evolution of the asset price, so make sure to follow me on Tradingview
If you have any questions or requests, fell free to ask @Djio_ .
Disclaimer : This is not financial advice as I am not a financial adviser.
This is just my knowledge on what can be said and done from the chart.
Due to the volatile nature of the market, everything can change on a day to day basis.
Everyone is wise to manage their risk properly when considering any trading decision or activities.
PS: I cannot emphasize enough the risk associated with the activity of trading ETF due to the imaginary nature of all paper contracts, the reason why I prefer mainly trading cryptocurrencies instead of more “traditional” assets. On the other end without total systemic collapse it can quickly become a good trade opportunity .
