2:1 RR Energy - Weekly Idea13/Jan/2020 08:19 PM AUTHOR: Brandon Gum
--
Part of me says not the best place to put your cash right now when software and tech are so hot.
Another part of me see's that if oil can stabilize here you might get a relief bounce and price recovery in both Oil and XLE.
======================
XLE trade ideas
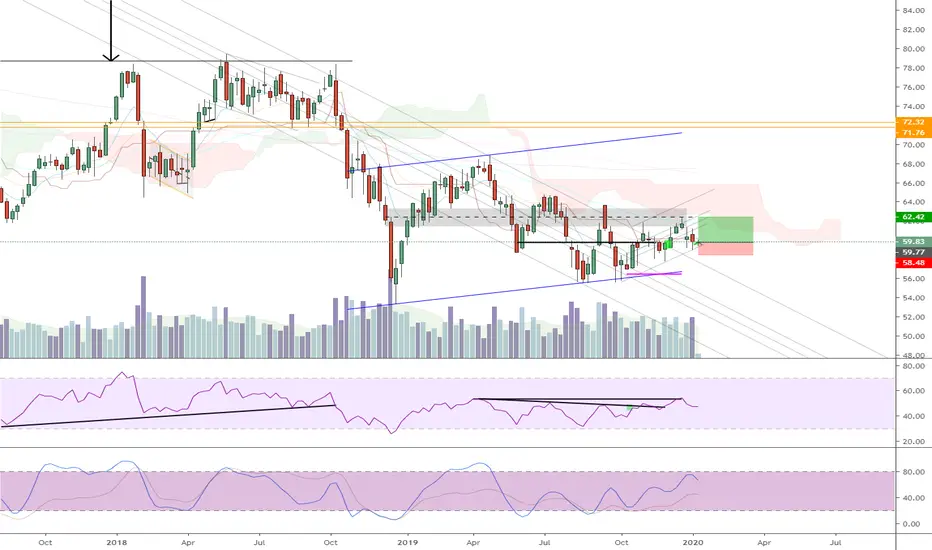
Triangle Pattern in focusXLE price is trading inside a Triangle pattern - between the 200 days MA line and the trend line marked in the chart.
A close below 60$ will probably drive XLE lower, towards 56$
A close above the 200 days MA line can lead to a rally that will take XLE all the way up to complete two bearish harmonic patterns (near 65-66$)


XLE still in triangle consolidation before a (hopefully)big moveTriangle pattern on the daily. If we can close above or below we are in for a big move.
Disclaimer: I currently have MRO JAN 17 14c and I plan to take most of the profits and wait for a breakout.


XLE Backtesting Breakout$XLE perfect backtest of breakout from symmetrical triangle. I love trading this type of backtest because RR is favorable and downside risk well defined $WTI $XOP $CL $USO #oil

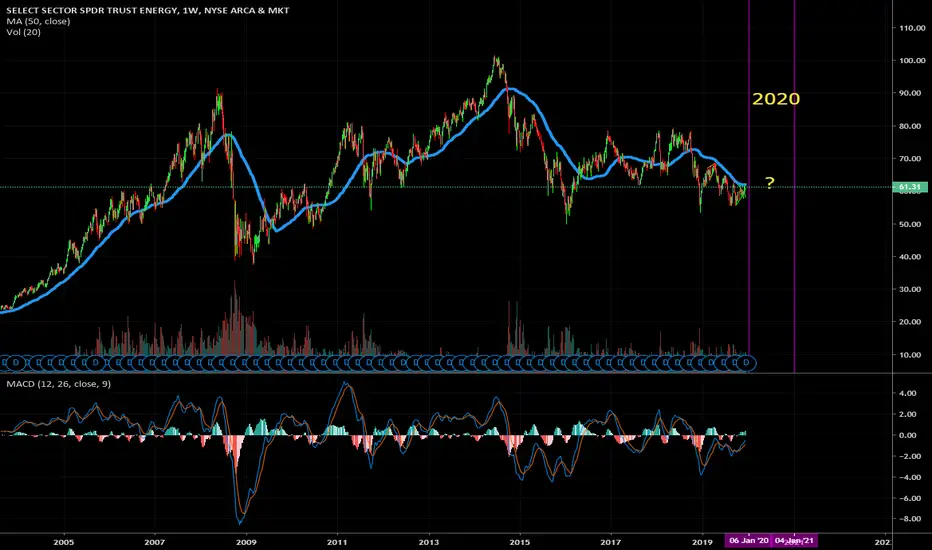
Energy the only sector not looking overvalued right nowDespite a big end-of-year rally in both oil and energy stocks, the energy sector remains attractively valued at the end of 2019. In fact, energy is the *only* sector that's attractively valued right now. XLE has a reasonable P/E of 15, a price-to-book ratio of 1.5, and a dividend yield at 3.7%. That's a solid return on capital, handily beating the 2.32% yield on treasuries and the 2.2% yield on the top dividend fund, DGRO. DGRO's P/E is over 18 and its price-to-book is 1.9, meaning that in that fund you pay quite a bit more for a lower yield.
The dividend yield on XLE has been improving for a couple years now, and I think the 4% dividend level is psychologically significant enough that we'll find a lot of support at that level. Some individual energy stocks, like ET and OXY, even offer dividends near 10% right now. In an overall extremely overbought market with some ongoing recession risk, this is a relatively safe long-term play that offers good value and solid returns. Did I mention that seasonal cycles favor oil right now? December through July are the traditional bull months for oil, according to the Stock Traders' Almanac. Rising geopolitical tensions with Iran and a cooling trade war with China also favor oil strength for the near future.

[Year End Thoughts] My 2020 Outlook.Rather than chasing the US equity bubble up here, I want to gross up when I can (on dips) in Energy, Real Estate, and Gold.
Energy is one of my best idea longs for the beginning of 2020.
- XOM is at 12-year rock bottom prices and will pay you a dividend to wait for the eventual uptick in Oil.
- The Fed is determined to "run inflation hot" even though CPI is already over 2%. We are going to get more inflation.
- Recent presentations by Mike Gordon on Hedgeye: www.youtube.com
- and on MacroVoices: www.youtube.com
- and a BofAML note: pbs.twimg.com
CNQ has already begun severely outperforming the US energy sector. They are a Canadian Oil Sands producer with excellent fundamentals:
Attached to the long Energy thesis is long Russia. Russia is a huge energy producing country and will benefit from increased prices.
Weekly chart of Russia ETF (RSX):
Related, Sberbank:
And Gazprom:
I like real-estate in an inflationary environment. In particular, tech-related Real Estate:
And of course Gold. I expect Gold to continue its bull run soon, within a week or two. However as one of the most manipulated markets, it can be very difficult to trade. I suggest slowly buying physical every time it goes down.
I believe the US stock market would have already collapsed, owing to liquidity problems indicated by the extreme spike in Repo rate to 10%. Had the Fed not begun throwing the kitchen sink at the problem, we would have already seen a deflationary bust. It seems like that money has flown into the S&P and AAPL:
I'm not entirely convinced that this WON'T end in a Venezuelan or Argentina style hyperinflation. So, I think foreign diversification (Russia and Gold) are essential holdings.
$XLE - short off the upper trend line, target $60-ishAMEX:XLE short, good risk reward, target bottom trend line

XLE with Clean Breakout from 10-month Channel$XLE Perfect 5-point channel from February with clean breakout. RSI breaking out. Could possibly see quick throwback to 60.40 (trend line retest & test of horizontal support), which would be a solid long entry from an RR standpoint $XOP #oil $CL $WTI

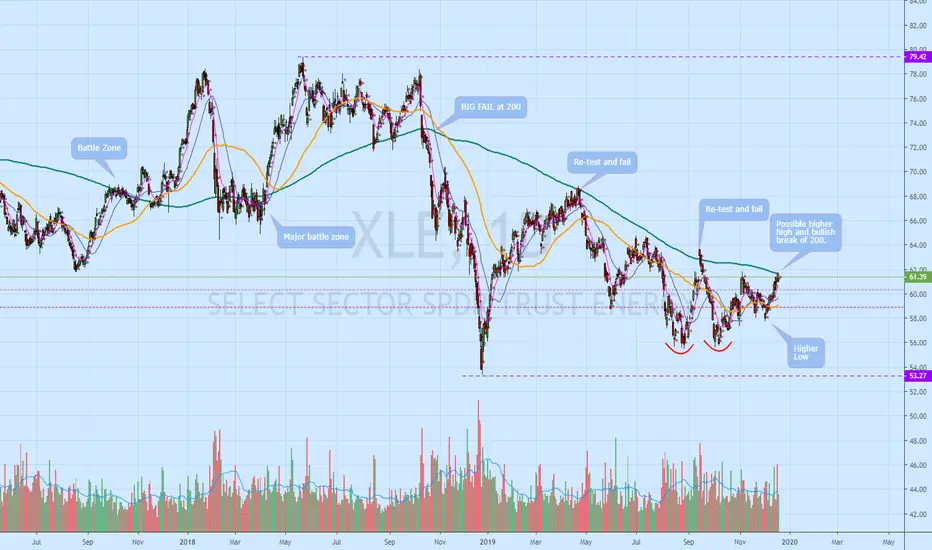
XLE at a key areaXLE has reacted sharply at the 200 sma in the past so I'm watching the price action closely here.
Can this hated commodity make a run higher.
Long Idea for Energy - XLE9/Dec/2019 11:56 AM AUTHOR: Brandon Gum
--
Wasn't too positive on the target and stop but i think are appropriate.
Given the relative underperformance of this sector the RR on this trade is a little lower than what I would like to see. Would prefer a 4 to 1, or even a 5 to 1, but I think its a stretch to target much more than I show right now.
======================


$XLE Lowering wedge with double bottom. Looks interesting.Possible bounce from a lowering wedge, will be watching.

you like apples? oil sucks, how bout them apples?I believe the correct term is woeful under-performance


Both oil and Energy in a Make or break situation here double topwe are right at the trendline here $62 … cross it up and we could move higher or are we moving down lower …..

XLE Above red area bullish. Below red area bearishNice move up in oil today so far but everyone will still be thinking short until XLE gets above this red area and find support.


XLE - Just a boost of energyThere is a double bottom pattern dating back to late August. Energy has been the laggard YTD & is the only sector in the red over the last year. This may be the beginning of the sector finding some strength.
If you take the Fibonacci 161.8% extension that gets you to a target of $68.79. The actual pattern breakout price target would be $71.60.
