XLE is poised for a breakout, as fuel prices rise. The world is not a very safe place at the moment especially if you own a Oil Tanker, current tensions in the middle east has seen oil prices rise considerably in recent days, threats of storm damage has even resulted in a price rise in Natural gas, thus the beaten down XLE may be a nice trade in the days to come.
We have outlined on the chart a possible trade strategy on a nearterm breakout.
XLE trade ideas

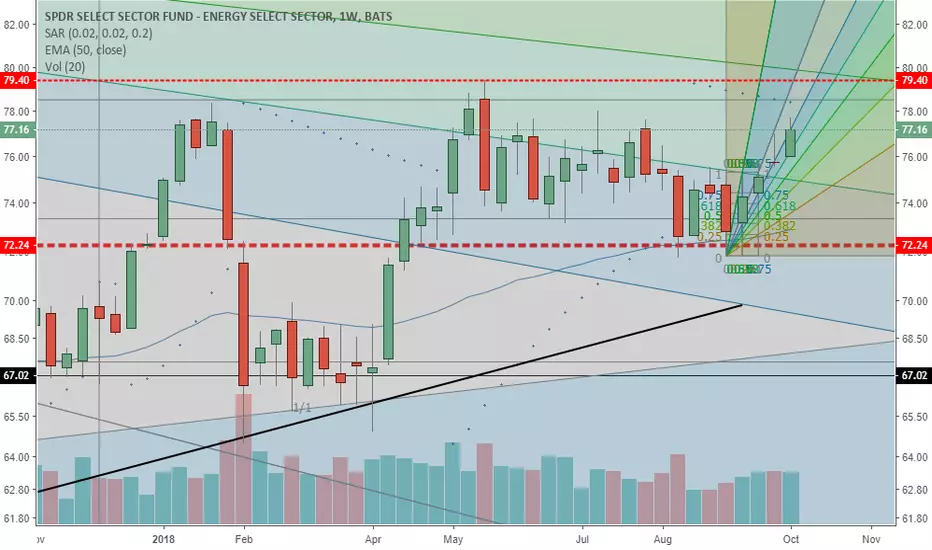
Oil stocks look bullish to me. XLE weekly log You can see we have had a long sideways consolidation which to me looks like a 5 wave triangle . If US Dollar continues to drop as I favor and with all the global turmoil in oil producing countries it is fertile ground for oil to rise. The dotted horizontal lines I see as resistance. Strong weekly candle last week and break of short term down trend line.
Have great week.

XLE SHORT ON A DAILY CHART XLE is currently the weakest sector among all other sectors and the market SPY is in basically in a SELL or an overbought area. Feeling bearish right now and shorting the weakest sector ETF is a good choice.
app.box.com


Closed bear call spread XLEopened bear call 14/14.5 for .27 credit
reached 50% profit target and closed on 5/29 for .14 debit
net $13 profit


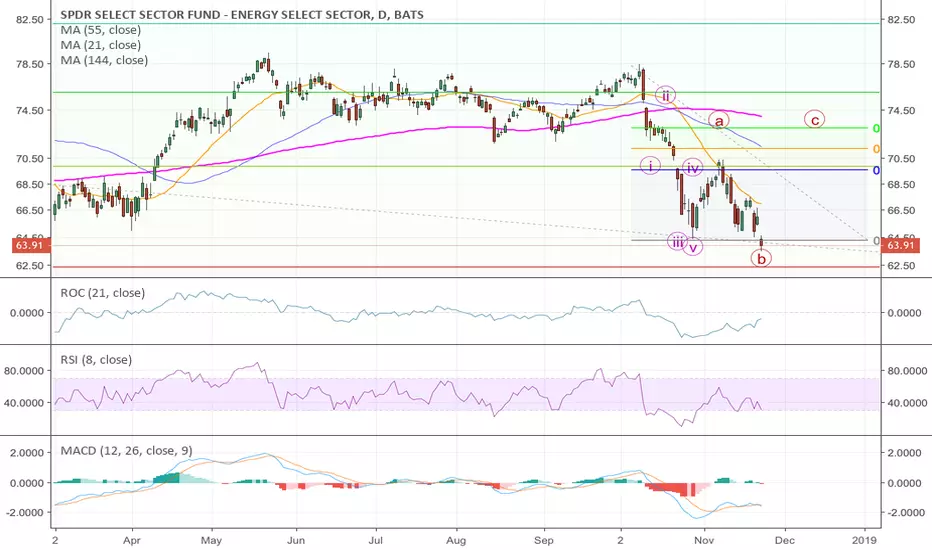
XLE - Bearish Inside Bar Pin Bar Fake OutAn inside bar / pin bar fake out pattern has formed on the XLE weekly chart. This pattern has formed just below a key resistance level as well as the 50% retracement of the last swing high/low, which is exactly the area we want to see this form. One negative with this setup is that price has formed a very sharp v-shaped reversal off it's lows. That doesn't mean that the pattern is untradable but it does mean any trades taken here need to be aggressively defended, and profit targets not be too aggressive.


Bearish DiveregenceReverse bearish divergence with recent bearish divergence. Price target is .618 of recent run up.


XLE Another Short ContenderXLE Similar pattern as SPY just at a steeper angle.
Has more downside than SPY.
Another solid contender for put options off of the pattern backtest.

XLE possibly bullishI believe we are in a long-term, deflationary bear market. Trading has been choppy and difficult.
However, many charts are reacting bullishly to yesterday's comments by Powell. It may be time for a "risk-on" rally and some low-risk trades might be available.
Here, energy stocks are showing a slight break from a descending wedge.
The MACD and RSI are showing divergence during the drawdown. XLE and Oil are both oversold.
The stochastic is just starting to rise.
I would consider buying a small GUSH (3x) position on an intraday pullback, targetting the 50ma.


XLE correction in progressAfter 5 waves down XLE is correcting, as it should. It seems we are in C wave up, good shorting opportunity is approaching.

Long XLEWith oil bouncing next week potentially, XLE is likely to bounce. Plus XLE held support very well this week although oil crashed. Long to the upper channel.

Short XLE (After next week's potential bounce)XLE has broken triangle formation. Expect it to retest the bottom trendline before further down. Short it if the retest fails to go above TL.
My OB/OS indicator has reached to the previous low level. Trade the bounce intraday or 2-3 days short term. Then resume the downside, expect it to break the previous low in my indicator.
LT TP: 41

xle wkly chart, can it hold 66? If no, the next leg down is 6266 seems to be multiple bottom for wkly chart

XLE Swing EntryGood setup for $XLE swing entry around $70, first target ~$73 with the eventual target hitting the upper line of the downtrend channel.

XLE Move is not doneWe all know the Iran sanction hit on NOV 1. It is most likely we at least tag if not breakout the prior highs. Strong demand for crude globally.