XLE trade ideas

XLE bullish weekly setupI am expecting XLE to contest 95 Q2 2019. With the weekly flag and early signs of push beginning I expect this sector to continue to strengthen and be a much stronger pick next year.

XLE Bullish Credit SpreadNew Bullish Credit Spread on XLE . Expecting to see a push for $75.59 resistance by EoW.
Entry 75.11.
Break Even 74.73.
1:1 r/r

XLE Ascending Triangle breakout.A close above 79 would lead to a breakout. Supporting this theory is rising inflation and a more dovish Fed. Recently Fed Governor James Bullard stated “If it was just me I’d stand pat where we are and I’d try to react to data as it comes in,”. More thank likely we will see more members of the Fed turn into doves as the year nears end. Which should create a bull run in the energy sector and commodities.

XLE - Energy Sector About to Poop Itself or No?The energy sector has been performing badly over recent months, but not as bad as basic materials sector. Specifically leading the problem in the energy sector are oil & gas drilling, oil & gas exploration and production, oil & gas refining and marketing, oil-related service and equipment, renewable energy equipment & services, and uranium industries. These industries are making new lows over the past month and over the past quarter.
It is quite early, but this should be on the radar for a potential shorting opportunity. If truly the beginning of a downward move, a further break of the support level around $72 would be a confirmation, and this should be expected within the next 2-4 months (pretty much from October - December, or even January) . Also, the idea of the downtrend could potentially be a recovery for a possible uptrend if the resistance levels around $76 and $78 are tested and broken.
The financial sector was also showing some milder weakness but more time is needed to tell how the sector is behaving. Watch the energy sector; what do you guys think?

XLE Short or Put spreadTriple top continuation to the downside. Just broke near term support of $74 now being resistance. Looking for an entry to short with $69 being the target.

Followup on my post of July 23rd Shorted it yesterdayThe XLEs finally broke support at $74. I put my short on yesterday at $73. My buy stop is $74 ad my cover target is $69.

XLE - (Short Premium) Selling premium into high IVR $$$Short Strangle, 20 delta (68/75 strikes), 37 'DTE, $1.07 credit

XLE monthly Breakout - Energy SectorEnergy has been lagging the oil recovery significantly. Looking at the RSI of XLE on the monthly chart suggests that this could be the month that XLE finally makes a sustained move higher. The month has yet to CLOSE above our RSI level, but its a starting point.


I am watching the XLEs for a potential short...I am watching the XLEs for a potential short. If the $74 level breaks and they get to $73 I will short them.
My stop-out will be $74. This is a logical level to have it at because it has been support since May. If it does break to the downside, it will most likely become a resistance level. A break back above this could mean it is going to rally back up to the $78 level, which was where the top was in January and May.
My target to cover will be $69. I think that there will be support around $68.75 because it was the top of the range from February through April.
Here are my 7 Trading Rules as applied to this trade:
1) IT IS MORE IMPORTANT TO KNOW HOW TO SELL THAN TO KNOW WHAT TO BUY. YOU SHOULD NOT ENTER A POSITION WITHOUT HAVING YOUR TWO SELL STRATEGIES DEFINED. THE OPPOSITE IS TRUE FOR SHORTING.
My buy to cover target is $69. My buy-stop is $74.
2) ALWAYS THINK ABOUT RISK
If I short it at $73 and cover at $74 it is a one point loss. If I short it at $73 an cover at $69, it is a four point gain. A 4 to 1 Potential Profit / Loss Ratio is appealing.
3) UNDERSTAND AND CONSIDER THE POSITION-SIZING DYNAMICS
I am not oversizing this position...I am using no more than 5% of my capital for this trade. This is my maximum amount to put in any trade.
4) LEARN HOW TO DEVELOP YOUR OWN IDEAS
I came up with this idea by analyzing the SPDRs
5) HAVE A VALID REASON TO TRADE
Break of a support level
6) DON'T BE MARRIED TO AN IDEA
I have a clear stop out strategy
7) DON'T OVERTHINK
I have clearly defined all aspects of the trade

Look for XLE breakout of cup and handle; bullish continuationIn previous research on bullish WTI I overlaid XLE and observed that there is a cup and handle. Cup and handle or ascending triangle or whatever pattern price zigzag combined with rising WTI says XLE is a bullish continuation.
Keep a close eye as that continuation pattern is now pushing against resistance.

Short XLE on break of trendlineThis 60m chart of XLE shows the energy ETF threatening to break through trendline support after completing a 5 wave impulsive move higher. Initiating a short position at 76.50 for a move lower, with an immediate target at 73. A move above 80 invalidates the setup.


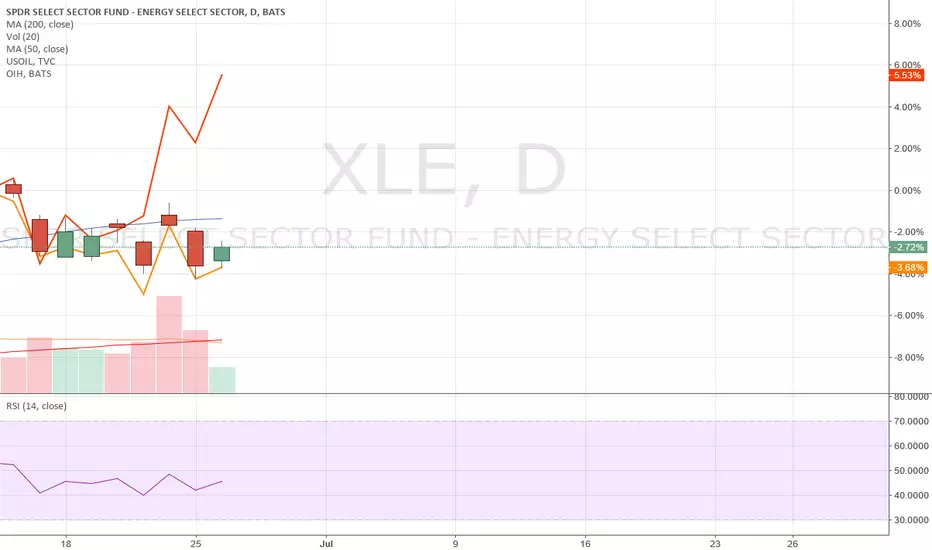
$xle and $oih vs $cl_fWhy aren't they buying energy stocks on this huge $7.00 10% ramp in crude? Hhhmm


XLE leading to the downside with XLFPossible H+S top formation in XLE
Could lead market to the downside along with XLF which is also about to break a 2+ year uptrend

XLE-WTI correlation; cue to XLE Cup and Handle 2-year breakoutXLE and WTI demonstrate high level of correlation i.e. move in same direction. XLE provides stock-ETF alternative for traders who do not trade WTI. Interesting to note that WTI has outperformed XLE since Q4 2017 while the latter was capped at a 2-year high printed in December 2016.
Bullish view of WTI and XLE
in previous piece I was looking for swing long WTI as a continuation trade. I see it sitting at potential support. At same time XLE is capped at 2-year high resembling a cup and handle pattern. If WTI long continuation is correct, XLE may do a breakout above this resistance. In fact there is room for XLE to catch up since it is underperforming WTI in the near term.
Bearish alternative
There is a bearish view. When correlation is found question is always which is correct A or B? What if WTI is bearish? Then XLE resistance is justified and the current underperformance would be easily justified as a divergence.
I stick to the bullish view.

THE WEEK AHEAD: XLE, XOPWith this quarter's earnings pretty much in the rear view mirror, there isn't much single name to play here, particularly since we start right back up again with earnings around the July monthly. Consequently, if you're going to play single name, you may get caught in a volatility expansion running into earnings, so if you absolutely can't resist the urge to pay single name, pay attention to when the next earnings announcements are for the underlying you're playing and take profit aggressively to avoid being "expanded" running into the announcement.
All that being said, there isn't much volatility in single name underlyings at the moment anyway: ORCL (earnings in 17 days), XOM, DIS, CAT, and MSFT round out the top five, but all have background implied volatility at or below 25% and lie in the lower half of their respective 52-week ranges.
As far as exchange-traded funds are concerned, there's no surprise there: energy and/or petro is where the volatility lies at the moment, with USO, XLE, and XOP in the top 5 (the others are FXE and XLU), with their ranks/background coming in at 63/30, 39/21, and 36/34, respectively.
Pictured here is an XLE July 20th 70/80 short strangle that is slightly skewed to the downside, since I think that is where the risk lies. Here are the metrics:
Probability of Profit: 70%
Max Profit: $113/contract
Max Loss/Buying Power Effect: Undefined/$1175/contract
Break Evens: 68.87/81.13
Delta: -9.81
Theta: 3.00
As a potential defined risk alternative, consider an iron fly in the smaller XOP: the July 20th 34/41/41/48 has risk one to make one metrics, is worth a 3.51 credit, and will pay better than the XLE short strangle at 50% max, assuming that price stays within your break evens of 37.49 and 44.51 long enough for you to extract 25% max (.88 profit) out of the trade.

8% Above 50 DayXLE is 8% above its 50 day moving average. Doesn't mean a *massive* reversal, can work off overbought over time.

Compare Equal Weighting to Market Cap Weighting in ETFsAdvance Decline Lines are powerful leading indicators.
Anothr way to explore leads and lags is to see how an equal weighted ETF compares to a market cap weighted ETF
Move the time horizon around to compare XOP (equal) to XLE (market cap)

Breakout Scenario suggests - Energy up! Breakout scenario in XLE
Consolidation range now should act as support
