XLE trade ideas


XLE-getting ready for the next leg higherXLE (energy sector ETF) has been consolidating sideways for a couple of weeks now.
It is showing signs that it's getting ready for its next leg higher .
Minimum target for me would be 71-72 the next month or so.
I did buy today the 66 calls expiring in nov series (monthly series).

I am bullish on energy. Cut the noise and look at price!!!Hey guys
Let's take a look at XLE. It is an energy etf. I look at all major sectors on weekend just to see the bigger picture. Weekdays i only focus on my pairs.
Monthly: Kijun holding as support and macd may reverse next month. So, far we only have a reversal candle.If chikou can get above price, that can bring more acceleration. It is neutal picture as of now with bullish bias.
Weekly: Price is above Tenkan and Kijun. Those two lines will be potential support zone going forward. Macd is crossed up.
Daily: Bullish. Currently it is consolidating with macd crossed down. Chikou is above price .
I like buying dips on it. Alternatively, you can look at oil and natural gas. Natty is also a beautiful chart . I will post in a bit. Thought to share.
Thanks for the read.

Long Energy to FinancialsXLE to XLF has done a 78.6% retrace, should at least outperform over the next few years here.


Predictive Analysis/Forecast | #XLE #SPDR #AMEXBullish-to-Neutral
Awaiting Great White signal
Awaiting bearish market reversal confirmation
TG-High = 93.08 - 02 FEB 2014
TG-Low = 42.77 - 02 FEB 2014
Geo impact = Nodal core
4xQuad


XLE a trade or an option trade, your pickThis ETF got rejected on a D1 time frame at the 23 Fib retracement...
With a complete retrace back to 0..., almost like a reverse cup and handle... look out below..
1: 1 Risk to reward, even more if your daring...
2. Sell the 62 Puts 2 weeks out, and buy the 64 put January... net cost is 3.47... keep rolling, and booking premium while the pair slides lower


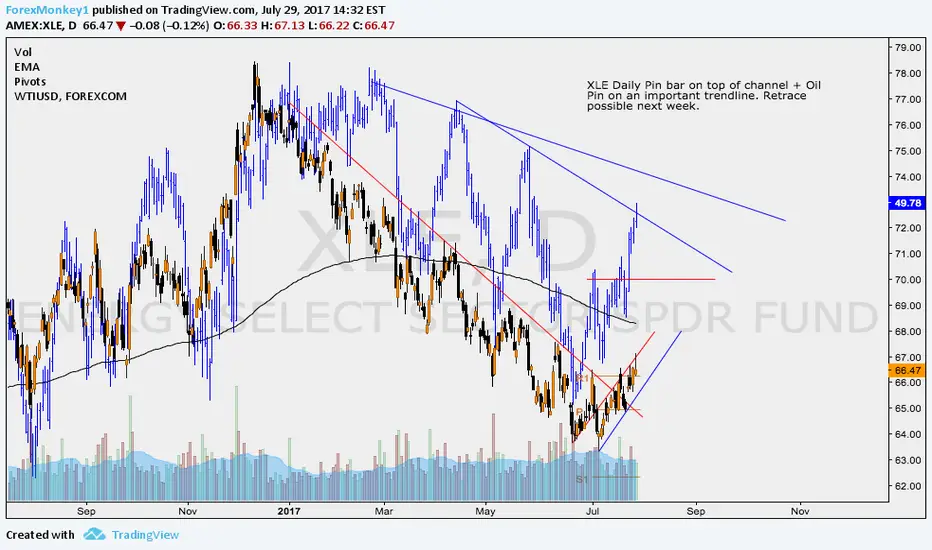
$XLE OUTLOOK COULD SEE RETRACE IN BOTH $WTIUSD AND $XLE. If we break the channel and go bullish we do not sell simple as that.

Head and Shoulders Vs. Bearish BatXLE is slowly making its way towards a very interesting weekly support zone - 60-62$
Notice that this price zone is the 61.8 Fibonacci level from 2009 low and from 2016.
Also notice that it is the neckline of a weekly H&S pattern.
If it will break, XLE can fall to 55$ and maybe even 50$
If it will hold as support, the extremely bullish scenario is that it will climb all the way up to complete a bearish Bat near 95$
Obviously it will have to re-test the MA lines as resistance levels first
Agree or Disagree?
It's Sunday.. you can read more about this setup and others in the newsletter
#WeeklyMarketsAnalysis (search on Twitter)

XLE flag weekly / double bottom dailyHorizontal S&R: dialy and weekly
Channel S&R: yes
MA S&R: some, 20ma
>200ma: no
Volume confirmation: yes
Candle Confirmation: no
Stoch Divergence: yes daily
Reg Trendline >85: yes
Short Float: n/a
Risk / Reward: 1.3 & 2. hope to get some at $65
Any feedback is welcomed.
looks like a good setup, though oil is a highly manipulated market.

