$XLE looks like a short- back to $60?I know everyone wants to be bullish energy, and I agree with the thesis over the long term, but the shorter term looks ugly.
XLE looks like it's topped out here and wants to fall back to the $70 range, or below back to $60 (as this region has never been tested as support on the way up).
I'd be a seller here and not a buyer. I do think a drop to $60 or so is a good long term buy.
XLE trade ideas

Long Entry for XLEAMEX:XLE
And this is a year to date look at the 11 S&P 500 sectors. What stands out is energy is the only one in the green. We saw an interesting call volume for Jan 23 Strike 95 $ and also from the chart it looks like a breakout soon. So you can already try to trade the breakout before it goes above 95 $ or you wait and put a stop at 95 $ with a tide profit target around 101 $. We see good chances that we will see the 100 $ in the ETF already this year.
The ETF is also a good for generating dividend income. At the moment you get 3.91% per year.
Stop Buy: 95 $
Stop Loss: 88 $
Profit Target: 101 $

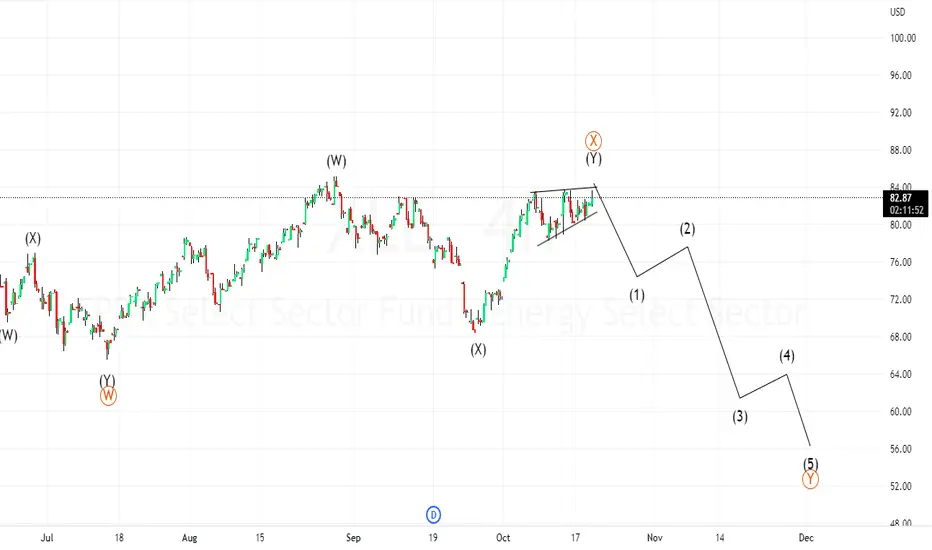
XLE: Looking for some Pullback XLE is in pullback territory.
EDIT! I say for TUESDAY but I mean for WEDNESDAY!!
Not sure I would be super bearish on this at this point. I know a lot of people are advancing very bearish ideas for XLE, but if we look at the buyers to seller ratios on XLE and XOM, they are huge. Far higher than on SPY on both the weekly and daily time frames.
As of the beginning of this week the buyer to seller ration on XLE was 1.30, whereas SPY's was below 1.01.
On the daily, after today, the buy to sell ratio was 3.34. This was a first time I have ever seen a buy:sell ratio that high outside of TSLA. Nuts!
So buyers are still present and until they back off a bit, I don't want to advance an overly bearish thesis on this. But that said, we are approaching a prime zone for shorting.
So tomorrow seems to be favouring a bit of pullback on the prob scale. I decided to get cute with reprsenting the probabilities and I represent them now as a ratio (bull to bear), which is so chicly and appropriately displayed with little rocket emojis.
I think, going forward, ideas I post, I will list the probs in this manner, just because they are visually easier to understand. You can see, for tomorrow at least, more bears are showing up than bulls. The ratio 5:0, meaning probability is favouring selling tomorrow.
So def looking for some pullback.
Targets for tomorrow are:
Bull
1. 93.36
2. 94.10
3. 94.84
Bear:
1. 92.94
2. 92.14
3. 91.34
Assessments of the most extreme targets (bull 3 and bear 3) show a preference for bull 3 at 4:1 favouring 94.84, which tells me that we may see a gap up into open.
Overall assessment and analysis:
You see on the Z Score indicator (set to the 50 candle mark) on the hourly chart it has triggered a sell warning. Sell warnings are triggered when the equity is approaching a previous pivot point on the Z Score scale.
It is also in minor overbought territory shown by the orange border.
You can see as well in the chart that XLE is at the top of its real time weekly range. It is also hitting the cap of its weekly prospective range, being 94.98.
Probs on the weekly favoured 94.98 at a ratio of 3:2.
Implications:
So what does this all mean?
Intra-day, look for pullback. Gap up followed by some selling.
But do not adopt an overly bearish mentality quite yet. This is still attracting quite a bit of buyers and while the 1 hour chart looks fairly bearish with a psedo-megaphone pattern and rounding top, we need to see the sellers chill out a bit and I would like to see a decline in the buying volume. We aren't really seeing a decline quite yet, just ranging between buys to sellers with no movement in either direction. We will have to see what next week brings.
As of right now, my immediate targets are the bear targets intra-day.
This is really the first time I am posting about XLE and was on request. Its a mid-week analysis which isn't all that helpful because the weekly high prob swing targets have already come to fruition. But if the interest is there, I can update with next weeks targets and probs and do an assessment on XLE as I do on SPY.
Safe trades everyone!
ALSO, FYI!
The Z Score you see in the chart is one of my publicly accessible, open source indicators.
The version I am using is going to be released as an update probably by the end of the week, I just need to do a video tutorial on how to use it properly.
If you are interested, here is the link:
Take care everyone!

XLE Recap Put SwingHello Acan here!
Here is the recap on the Put Swing for Energy sector.
Patience is key on swings that's for sure.
Should have added more contracts on the rejection of trend but I didn't, end of the day a win is a win.
Bought contract at .51 and sold at 1.53 a 310% gain.

XLE & Energy should be topping here Medium to LongtermEnergy should be topping here looking it at as a whole, OXY also at a great longterm short. Looks like a giant right shoulder on XLE from 2007, I think energy stocks should rotate into growth for the next bullish sector.

Risky Short: Double Top on $XLEEnergy is a volatile sector, nonetheless, from a TA standpoint, a quick short seems promising. (Not FA)
Typical oil rallies against $DXY. Seeing that DXY just broke its yearly parabolic run, this id definitely a bet of an anomaly.
China opening up the Covid lock-downs also plays as a head wind to keep in mind.
PT: 85, 80, 70.

Energy ETFXLE has been pumping for a long time now.
Shooting star yesterday then a strong candle today.
Volatile sector for sure.
No recommendation.


XLE to break bullish triangle + OPEC cutOPEC threatens to cut oil prices ten times more than in September in an attempt to plug the oil drain.
- The New York Times' sources estimate that the agency is considering announcing a cut of between 500,000 and 1 million barrels per day, about 1% of global supply, because the market is oversupplied and demand is softening due to the weakening global economy.
This plus the bullish triangle a good take profit could be around 90-93 usd.

Energy - Relative OutperformanceWe all hear a lot of market talk, but the simple fact of the matter is that energy ($XLE) has been steadily outperfoming $SPY here on a relative basis for some time. Many equity indices are constructed with little or no Energy, and that under weight has been a detriment in this environment.

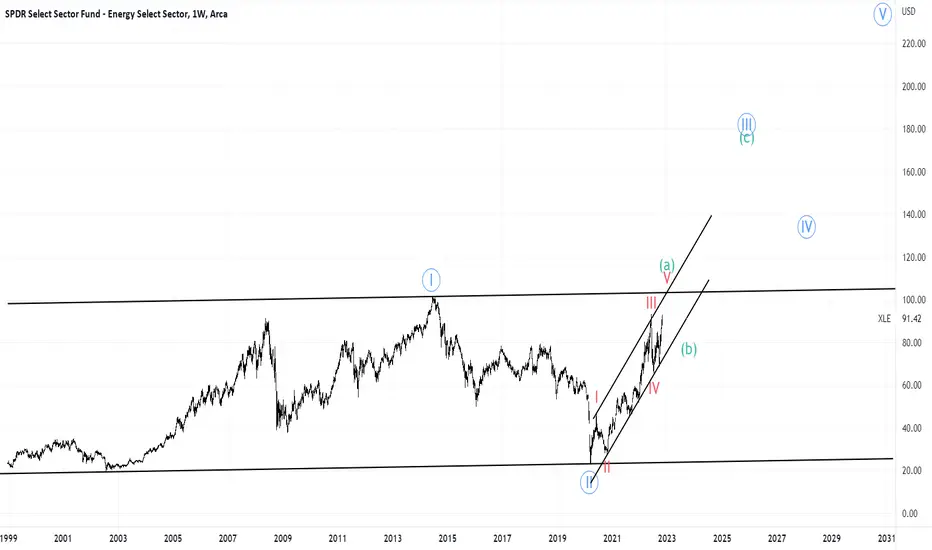
Chart Request_XLE Harmonic Elliott Wave AnalysisThe chart looks very nice and honestly one of the easiest ones to count as it is respecting many principles of Elliott and technical analysis perfectly. I see that we are in the final stages of wave V of (a) of III, which I expect to peak at the ascending channel upper trend line.
10% pullback likely for Energy Sector stocks from current levelsBased on Monthly parallel channel, we have major resistance around 90$ with double top likely at 93$. Easy pullback likely to 80$ from current extended levels.
SL : Confirmation above the monthly channel
Target : 80$

🟩 $XLE: +9.14% WIN, Second Half OffTaking the second half of XLE here.
Second half has win of +9.14%
First half had win of +6.65%
Blended win rate: 7.95%
Initial Stop Loss was 4.36% hence this is 1.82R win

XLE daily pinnacle pattern after we retested bigger oneBuy Stop 84.39 LMT 84.39 GTC
Sell Limit 92.54 GTC
Sell Stop 78.62 GTC
XLE daily pinnacle pattern after we retested bigger one if we break it there's nothing in our way.

Energy sector, bullish?AMEX:XLE is showing signs of strength on the weekly time frame. Most oil & gas companies have had a great run YTD, and the energy is sector is among the few green sectors YTD.

$XLE: +6.65% WIN, Taking Half Off This might continue to run, but I want to take profits into strength +6.65%
I am only taking half of the position. For the rest of position stop loss is at break-even.
This way I am GUARANTEED profit for at least +3.33% on the whole position.
With this technique I have massively improved my worst case scenario.
Probability is high for a pullback.

XLE is ready to move down- a deep Gartley is almost achieved
- it could be longed again when bouncing down to the trend line

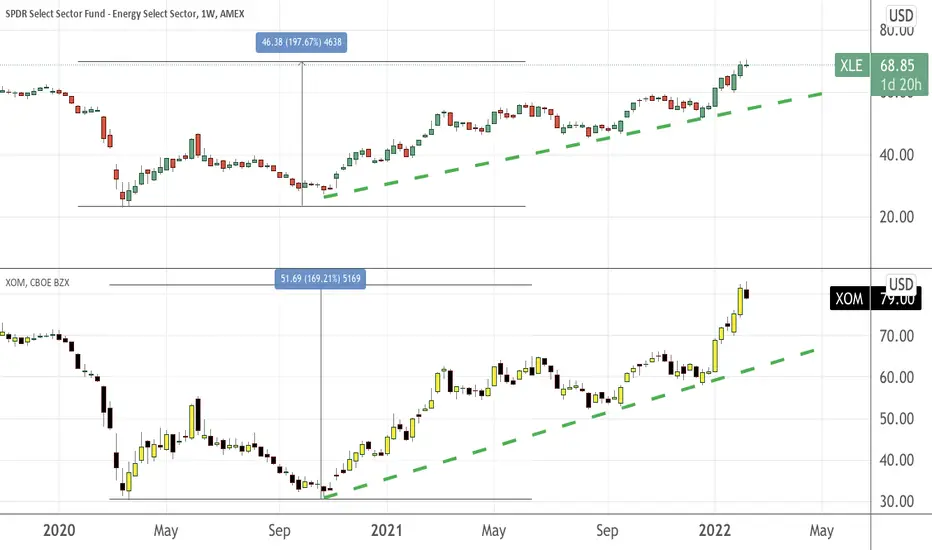
Comparing XLE performance and XOMFirst thing first, let's take a look at the components of XLE here
You can see that Exxon Mobil and Chevron takes up almost half of this ETF portfolio. Unless you are familiar with the FA components of individual stocks, investing in an ETF like XLE can be a cost effective and hassle free approach.
Performance wise, you can see that from March 20 to current date, XLE has gone up almost 200% vis-a-vis 170% for Exxon Mobil. Also, buying into individual stocks can be costly as well along with the risks contained in a single company. For detailed explanation, read here
$XLE - moving Stop-loss to break evenThis is @ +4.34% winner. I will move stop loss to break-even to improve worst case scenario.

XLE -- Long --Inverse head & shoulder breakout
--long looking strong
--RSI at 70 and hit short target, might come back for a re-test at the neck line
--Could be an entry point again at the re-test at the neckline

The Third Greatest Short of all timeHello friends.
Our original XLE idea was the greatest short of all time. XLE collapsed.
Then we had an idea for the second-greatest short of all time. XLE collapsed.
Now, here we are with the third greatest short of all time. Is this time different?
Demand for energy is being demolished by increasing interest rates, and the price of natural gas has collapsed plus the price of crude oil is down badly. XLE doesn't seem to notice yet, but it may notice in the future.
Short entry: $84.25
$XLE #Oil Bullish Setupmany oil stocks looking like $XLE
Shakeout in the base and back to recent base highs with volatility contracting.
