Something to Watchno confirmation = no trade
no profit margin = no trade
must get a confirmation on LTF
Either 15M Timeframe or 10M or 5M
we must get a change of trend on those timeframes like price coming into the zone with LL/LH and we need HH/HL To come in!
that's how i enter 99% of my trades
XLF trade ideas

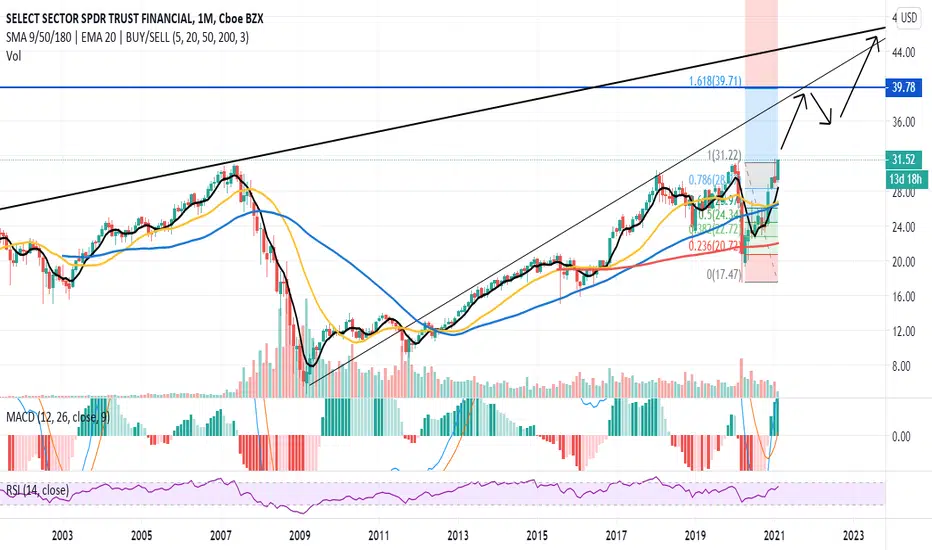
Financial ETF Is Attempting a Historic BreakoutThe SPDR Financial ETF quietly did something historic last week: It closed at the highest price ever.
This is a big deal because XLF has been trapped at resistance running back to 2007 (before the subprime crisis). It was trying to break the old highs around $31 exactly a year ago, then lost 44 percent of its value when the pandemic hit.
XLF jumped early this year to test those levels, retreated to its 50-day simple moving average (SMA) and quickly rebounded. Traders will now be watching to see if price can escape from the tight consolidation pattern between about $31 and $31.60.
Fundamentals could be more positive than a year ago because the yield curve has steepened dramatically. (The difference between 2-year and 10-year Treasuries has increased from about 20 basis points in February 2020 to about 110 basis points.)
The higher long-term rates result from the stronger economic backdrop (also displayed by oil prices). That healthier economy offers two other potential benefits to banks: more lending and fewer loan defaults.
TradeStation is a pioneer in the trading industry, providing access to stocks, options, futures and cryptocurrencies. See our Overview for more.

Are Financials going to lead the recovery in 2021?With how rates are moving, it seems almost silly to bet against a US recovery. Banks are the place to be in 2021
Call Ratio Spread - Long 2 Jan2023 40C Short 1 Jan2023 45C

XLF ...at resistance now..false breakout.....could be forming. The next open session should push prices higher before correcting....

XLF breaking out?Once XLF closes above trend line on weekly chart and opens Monday 2/15/21 higher than Friday's 2/12/21 close I am expecting a breakout. I will be buying September out of the money options around $34. Right now they are $1.20. It could possibly 3x in relativity short period of time. If it is rejected at trend line it could be a triple top and get slapped down pretty hard. I am leaning towards a breakout. I am not a financial advisor. Do your own DD.

Financials approach huge breakoutThe Financial Select Sector SPDR Fund (XLF) is near a breakout from a long base which favors long-term upside.
Previous rallies in early 2018 and 2020 stalled out near the pre-financial crisis peak from 2007 near $31. Now, in early 2021, we see another attempt to stage a major upside breakout, which would confirm a massive 14-year base. A move through the $31.40 area would be the signal, though I will be waiting for a break of $32 for confirmation. Banks have enjoyed a run with rising long-term rates, and net interest margins should improve as the yield curve continues to steepen.
However, a lot hinges upon whether the U.S. economic reopening and rebound can continue. January saw a surge in corporate bankruptcies; while Congress recently confirmed that there will be no stimulus in February, pushing much-needed economic assistance for individuals and small businesses out to mid-March at best. For now, I do like this group short-term - we are seeing good technical price action in stocks like JPMorgan Chase (JPM) and Bank of America (BAC). But intermediate term, it's got to prove that this rally has legs, and that could be a tall task.
If you are betting on a strong recovery, consider these financial stocks with bullish charts: Blackstone (BX), JPMorgan Chase (JPM) and Charles Schwab (SCHW).

Short XLF financialsTop of range, overbought, good sport for a pullback with good risk/reward. banks also at top of ranges

XLF Ready for a reboundThe financial sector index (XLF) is down 8.5% from its recent high on 1/14. It is now testing support at 29. The hourly oscillators are in oversold territory. If XLF can break the downward trendline then it has the ability to go back to its recent high at 31.5.


Select Sector ETF: By & Hold: USABy Sun Storm Investment Research
A Profit & Solutions Strategy
Disclaimer: I am not a financial advisor, so please do your own research before trading anything

$XLF Financials fill their gap from February 2020. Now what?!?The financial ETF $XLF has filled its gap from February 2020. It's now indicating overbought conditions on the daily RSI. Perhaps some consolidation is in the cards over the short term....

Triple TopThe financial sector on its way to a triple top. It’s about time to end this bubble. TP 21(MA 200), and SL at 34.5.

XLF Gap almost filledXLF about to fill that gap back from February 2020. Use this information as you will.
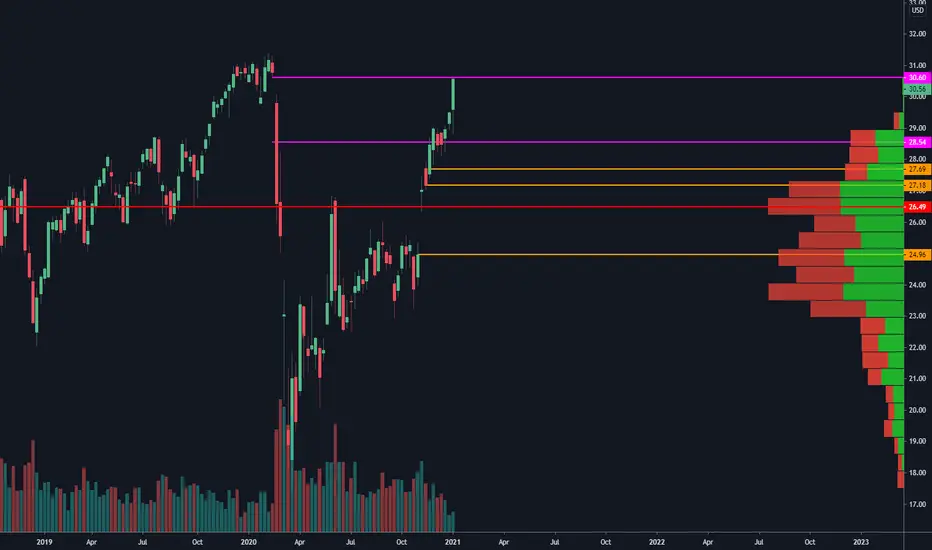

Bank etf year in review: O $30.47 H $31.38 L $17.49 C <=> $29Bank etf year in review:
O $30.47
H $31.38
L $17.49
C <=> $29
Do your own due diligence, your risk is 100% your responsibility. You win some or you learn some. Consider being charitable with some of your profit to help humankind. Small incremental steps work : If you double a penny a day for a month it = $5,368,709. Good luck and happy trading friends...
*3x lucky 7s of trading*
7pt Trading compass:
Price action, entry/exit
Volume average/direction
Trend, patterns, momentum
Newsworthy current events
Revenue
Earnings
Balance sheet
7 Common mistakes:
+5% portfolio trades, risk management
Beware of analysts motives
Emotions & Opinions
FOMO : bad timing
Lack of planning & discipline
Forgetting restraint
Obdurate repetitive errors, no adaptation
7 Important tools:
Trading View app!, Brokerage UI
Accurate indicators & settings
Wide screen monitor/s
Trading log (pencil & graph paper)
Big organized desk
Reading books, playing chess
Sorted watch-list
Checkout my indicators:
Fibonacci VIP - volume
Fibonacci MA7 - price
pi RSI - trend momentum
TTC - trend channel
www.tradingview.com


XLF short zoneLooking to see XLF test around the gap or previous highs. Various targets below, 200dma looks like a minimum. 200dma is still sloping down so it seems a sideways chop would be the most bullish scenario until momentum shifts more.

GOING UP FOR THE GAP FILL! UP!The trend is bullish daily & weekly, trend is your friend - I bet this will go up and fill that gap soon!
UBB not in the way, RSI not overbought. WIll spy blue sky, this will push up higher to fill the upper gap!


XLF - Elliottwave analysis - WXY complex correctionXLF - In 4 hr time frame, it is more like a choppy corrective pattern as WXY, where Y wave is in progress as further ABC. B of Y is in progress and generally would be dip correction. The X wave was triangle in nature, so there is a possibility of B wave to be flat like correction and after that, C will again start to rise higher to finish the pattern.
Give thumbs up if you really like the trade idea.

