bull questioable? actually xlv go up while spy go down? sector rotation?
Back always 72# bull last d days
XLF trade ideas

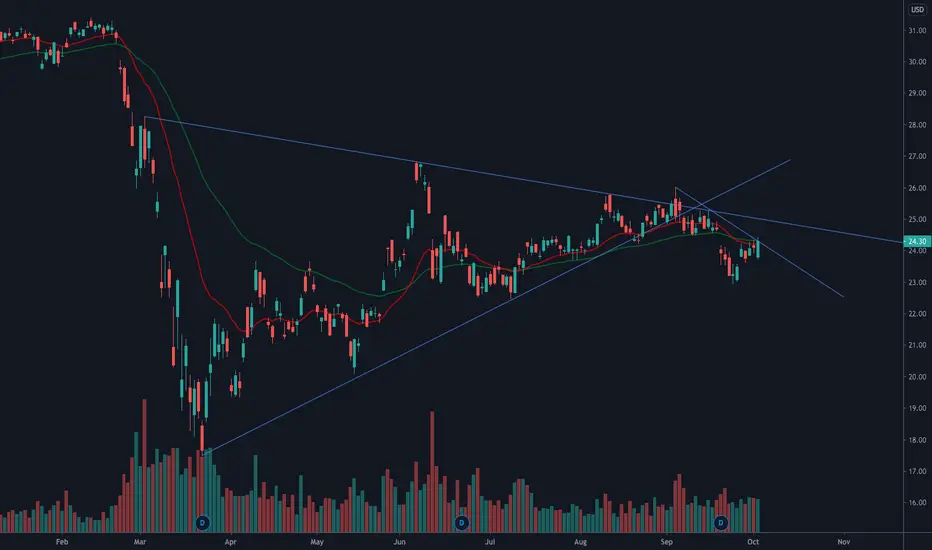
Financials Tried to Break Out, But They Didn’t SucceedThe Select Sectors Financials ETF is closely associated with stimulus and a reopening of the U.S. economy. Now that those hopes are fading, it may present a downside opportunity.
The main thing jumping off XLF’s chart is the falling 200-day simple moving average (SMA). This has cut down like a knife since the pandemic began, quashing rallies in June and early September. Now in October, prices tried to break out but they didn’t succeed.
XLF has also traded in a relatively tight range recently, which we see in the compression of both Average True Range and Bollinger Band Width. If volatility increases, that range could widen with prices declining. Levels like the September low under $23 and the July low around $22.50 could be in play.
Overall, XLF is a pretty straightforward play on economic sentiment. Unlike technology and the Nasdaq-100, it has little benefit from coronavirus. Traders expecting more negativity and potential nervousness around the election may apply pressure if the situation worsens.
TradeStation is a pioneer in the trading industry, providing access to stocks, options, futures and cryptocurrencies. See our Overview for more.

XLK/XLU Short. Look to add to any bounce above 40 XLK/XLU has broken medium term support going back to March 2020. Rallies back here should be sold, as resistance on the top side includes short and long term fib, 100 and 200 day moving averages, and very long term trend line resistance dating back to 2018.
Fits in with my view that deflation still going to get worse, and a banking crisis is coming. Very good levels to short this in next 2%-3%

Financials in trouble200sma has been a strong resistance since the March drop. The red circles show 4 times trying to get to it.
Placing fibonacci retracement lines shows confluence with a support level (green rectangle from late June --> early July)
The 20sma crossed below the 50sma on September 27th. (Bearish signal trend model)
Also, if we close at the current price, we are getting a bearish engulfing candle.
I would feel comfortable getting in around $22.7, being fundamentally bullish on the sector.

$XLF chart reviewBanks/XLF still very weak. not thinking about trading this until it breaks the march downtrend.

What are the banks saying about EUR, USD, JPY and GBP?I receive bank research each day...
I'll drop some of their comments here/
Euro
Citi: EUR trades marginally below overnight highs around 1.1730 at the time of writing (-0.1% in Asia). As a reminder, CitiFX Strategy still believes the EURUSD correction has room to go and it is not yet time to fade it. Several factors, including a slightly less dovish Fed, derisking into US elections, and USD positioning all support this thesis. Strategy is still structurally bullish EURUSD but prefers to add longs on a deeper correction towards 1.14.
JPMorgan: No real reason for the move higher yesterday and it was a little strange when you consider that stocks and commodities were lower on the day. But the head scratching wasn’t confined to EURO, where EM which ignored the positive risk rally on Monday, chose to rebound into midday, before retracing somewhat. The random price action could be a result of Month/Quarter end flow and while I have no insight into whether this is indeed the reason or not, this afternoon is likely to be volatile as the story plays out. O/N the Biden/Trump presidential debate was at times farcical, as both candidates thought the way to make an impact was to name call and see who could shout the loudest. While there was no clear winner, Biden’s betting odds widened by 7% points and the Election remains his to lose. While Biden extended his lead, it was clear that Trump is unlikely to go quietly, meaning a contested election is still very much a concern for markets. But with polls suggesting that 87% of Americans have already made up their minds on how they will vote, these debates may be nothing more than a 3 part Comedy drama. Watch the wires for headlines as Lagarde and Lane are due to speak at today’s ECB watchers Conference and Brexit discussions continue. Mnuchin and Pelosi also continue to talk although an agreement still feels unlikely. All of this may be insignificant, if the much anticipated Month/Quarter end flow dominates proceedings as expected this afternoon. We had been tactically short EUR/USD but are now playing things very close to home, as we try to navigate the potential volatile moves this afternoon.
ING: EUR: All eyes on Lagarde USD weakness helped EUR/USD yesterday absorb the new of a possible delay in the EU Recovery Fund as some countries look determined to use the veto if the rule-of-law conditions are not dropped. Today, the pair appears more vulnerable, also due to some potential Brexit spill-over. President Lagarde’s comments will be closely watched amid rising speculation over a rate cut.
Danske: Although EUR/USD is again on the rise, sentiment across inflation expectations, equities and credit continue to appear weak, and it is, in our view, too early to call off further downside in the pair. Indeed, to the extent that the Danish experience with new COVID-19 lockdowns is anything to go by in a broader context, it is worth noting that consumer spending (card and mobile payments data) are starting to show signs of weakness. We still view EUR/USD as rangebound with risks tilted to the downside towards 1.16 near term. What could make us change this view? Progress on Brexit (watch for whether 'tunnel' negotiations are reached this week), a 'clear' US election outcome and thus a US fiscal boost, and/or central banks renewing their reflation vows. Today watch for ECB speakers at the Watchers conference and for Fed minutes for any hints on the latter, although we think it is too early for a major shift on either side of the Atlantic.
GBP
Citi: GBP mirrors AUD movement, trading down -0.2% to 1.2840 at the time of writing. After the London close, headlines on Bloomberg emerged that the EU has rebuffed a new round of UK proposals on state-aid rules.
“The British offer still doesn’t go far enough, according to two officials in Brussels, who said insufficient progress has so far been made for the talks to head into the intense final phase, known as the tunnel, at the end of this week.”
Talks will continue before a meeting on Friday between chief negotiators Barnier and Frost, where yet another round of talks could be proposed to iron out remaining differences, should no breakthrough be found this week. CitiFX Strategy’s Adam Pickett outlines expectations here: Nothing new from Brexit and BoE headlines.
Also note that the EU’s deadline for changes to the UKIM Bill is today – infringement proceedings against the UK are expected to start on October 1.
JPMorgan: Choppy day for sterling yesterday in which we saw much of Monday’s strength reverse as talks continue in Brussels, the highlight of the day were reports that the UK had sent 5 draft legal texts including one on state aid i n an effort to advance the talks however subsequent reports had European sources saying that the proposals did not go far enough and that insufficient progress has been made to enter the tunnel phase. Flows were pretty light although the HF sector did turn to small net sellers tempering the exuberant run (4 sessions) of net buying into the talks. The IMB meanwhile trundles on clearing the HoC hurdle and now moving to the House of Lords in which it should fail –what follows is then an iterative process between the two houses after a few rounds of which Johnson will be able to force it through anyway –developments here are unlikely to impact negotiations this week. The situation will remain opaque and will be punctuated by brief noises in either direction –our overarching suspicion is that political leaders will need to get involved to agree on the thornier issues and thus the tone could take a turn for the worse into the end of the week. As such we remain in tactical mode here as we end the teeth of month and quarter end rebalancing today. 1.2780/90 remains supportive ahead of 1.2740/50 (0.9115/20, 0.9065/70 EURGBP) while 1.2880/85 remains resistance with 1.2930 above (0.9165/70, 0.9220/25 EURGBP).
Lloyds: The rally from 1.2675 has backed away from 1.2935/45 resistance. A move through there opening an extension towards 1.3010/50 with a break there suggesting 1.2675 was a meaningful low. A slide back through 1.2805/1.2780 support would suggest the rebound from 1.2675 is merely another correction risking another test lower to the 1.26-1.25 region. Longer term, we are biased that the bear cycle from the 2007 and 2014 highs completed with a major ‘double bottom’ in the 1.15-1.14 region. However, we are monitoring the current pullback closely and watching 1.25 and 1.20 key supports.
USD
Citi: Month-end: CitiFX Quant’s preliminary estimates have also suggested that USD pressure should prevail. The sharp losses in equities in September leads the asset rebalancing model to suggest a rotation into equities from bonds with a moderately strong signal at +0.8/-0.7 historic standard deviations respectively. The FX impact of the signals is likely to be USD buying, with the signal significant by historic standards (over 2 standard deviations).
JPY
JPMorgan: Biden seemed to hold his own as Trump turned the debate into chaotic theatre and while Biden’s advantage in betting odds has grown ~7% overnight it is also becoming clearer that Trump will not go quietly, the risk of a contested election is very real and probably rising –as such risk is trading on a softer footing for now. However price action today will be increasingly hard to put into context as we have month/quarter end to deal with –USDJPY was pretty bid in Tokyo into Japanese half-FY and go to be touching resistance at 105.75/80 yet again before risk turned, this will be a focal point today should the implied rebalancing (from MTD stock divergences) come to pass. We are looking to sell USDJPY further onto a 106 handle today if we get the chance, through105.75/80, 106.50/60 is the next level above, meanwhile 105.20/25 remains solid with 104.85/90 below.

XLF- Mac-D serving as an early buy signal.AMEX:XLF has seen some channel trading from 2018 too early this year. Finding its range peak in February of 2020 it crashed hard and has been working it's way up since. In red and green (A-D) are the main support and resistance levels and I have noted on the MAC-D where price has reversed, and also accounted for some major financial events such as the Chinese trade war and COVID-19 pandemic. XLF seems to have found its new channel and will either retest its support on the downside and hold the channel or test the SMAs as resistance on the upside and possibly find its way into the former price range leading up to the election. I am going to use MAC-D as my signal to buy as we near a cross.


XLF Banking SPDR,, Breaks Down Sharply on Bank Fraud ChargesThe XLF Select Financial SPDR has this week broken down sharply
with Point + Figure Daily Projections now Bearish to 20.79,
or another 10% move to the downside possible.
The catalyst for the sharp break came yesterday with Buzzfeed reporting
that potential criminal indictments of certain EU banks, namely Deutche Bank (DB)
are possible,for money laundering trillions of dollars of criminally linked bank funds.
The news, and what may come afterwards, has the potential to induce a high amount of liquidity strain to the sovereign banks,
With borrowing rates at almost historic lows, as well as already being negative in larger European banks,
the prospect for a quick recovery to this latest crisis grows increasingly unlikely by the hour.
World markets need calm, consistent and very strong financial trading partners,
untainted by the news coming out of Europe this week,
Should any type of this news, with a criminal underbelly cross the ocean to the United States banking system in particular,
then the crisis could potentially explode casting potential liquidity issues here at home as well,
Thus I suggest that you, stay completely away from these money center banks being questioned,
for money laundering fraud until the cycle of drip by drip bad news stops.coming out.
However, it appears that potential fraud discovered recently,has actually been going on unchecked for decades now.
meaning it was approved from the top on down, in a systemic bow to the lawless, to use the system as they needed, and saw fit
THE_UNWIND
SEPTEMBER 23,2020

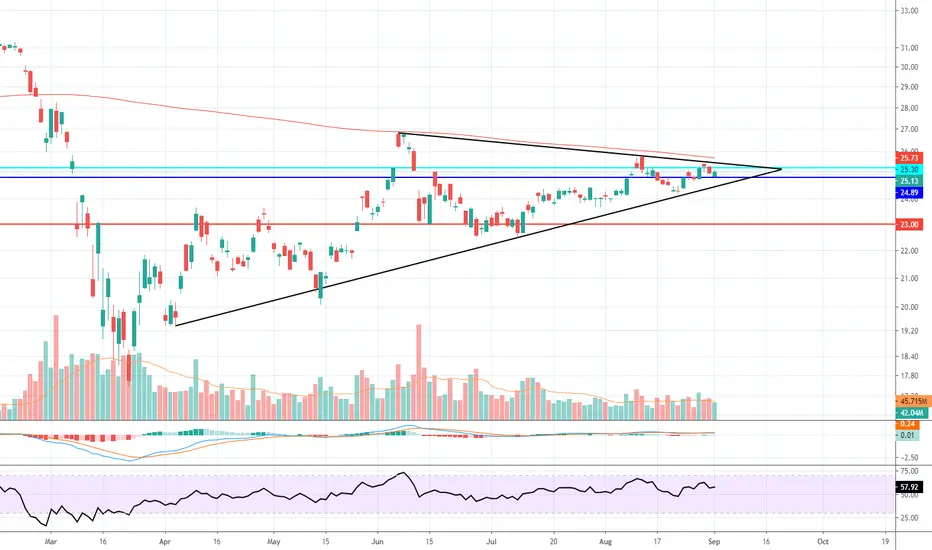
XLF Getting as tight as it can getPicture perfect chart here.
Only 4% between following key levels:
- Support line has been tested 5 times & now coinciding with 50 dma
- Resistance line has been tested 2 times & has been coinciding with 200 dma
Daily RSI convergence confirming price action
While in the middle of those support / resistance lines, 2 major dma's, we are also stuck between the 50 & 61.8 retracement levels (Pre-Covid high to Covid low)
Is the massive $C breakdown this week to be interpreted as a signal of strength or a look into the future for the financial sector?
With $XLK & $XLV having already posted huge recoveries and subsequent gains on the year, is it $XLF's turn to run hot in the reflation trade?
Can $XLF hold its gains if the rest of the broader market continues to sell off lower, representing what would most likely be dubbed the 'Great Rotation' ?
So many questions, however I think this chart & the $SPX chart is all you're going to need over the next month and a half heading into election.
If (lol) - WHEN this thing breaks out, on notable volume and a huge move in the RSI, I think it'll drag the market along with it, whether to the upside or downside.
** I am currently sitting on a bullish $BAC position, so my bias is bullish but it can easily head the other way.

XLF Looks to Be Topping OutXLF getting rejected by the upper diagonal.
RSI and volume trending down.
Expecting this to trade down or sideways after one final rejection.
Implied volatility appears to be on the floor, ripe for a spike.


$XLF FinancialsSimilar to the small caps Financials have had a less enthusiastic rally compared to tech and while they have also rallied from the March lows, the uptrend seems to have broken and is heading likely downward. Look for financials and small caps to be a drag on any rallies that the markets may make in the coming days.


XLF broke the equilibrium upwardsAs tech started consolidating XLF broke the equilibrium upwards which is positive for banks and laggards depending on govt support... airlines, hotels, cruise liners etc

US Financial and Utility Sectors Long TVC:SPX AMEX:XLF AMEX:XLU
Possible growth potential for both XLF and XLU. The greatest deviation between XLF / XLU and S&P 500 before the market drop was ~5%, currently, both sectors are yet to fully recover following the overall trend of the SPX index, looking at an approximate 17% and 14% gain for XLF and XLU respectively in the next 6-8 months.
Supported with the indication of no rate changes proposed by the FED.

XLF Breaking outUpdating the XLF idea from before. RSI looking strong, while volatility is down. Volume consistent, this should continue running past the break out.

1. Await breakout 2. Lt it pullback 3. Buy3 Simple steps to follow if you want to buy this ETF.
Let the price action breaks out of 23.58 price level acting as resistance.
Next, see if the bullish signals is sustainable , watching the candles closely
If the above criteria meets, buy , put your SL at 19.95. This is assuming you are not trading but wanting to hold for the mid to long term or at least till the trend reverse.

XLFBlue line has been support/resistance almost 20 years. Light blue for 3. Don't think it's a coincidence that's the center of the triangle. Big move coming soon imo.


XLF Inverse H&S breakout. As noticed yesterday XLF seems to be trading in series of H&S patterns. We've had a confirmed breakout of the IHS pattern it had been forming.
It appears that the height of the breakout is equal to the previous head. I'm projecting this will run up to touch test the 200 DMA which is around $25.75-25.80
