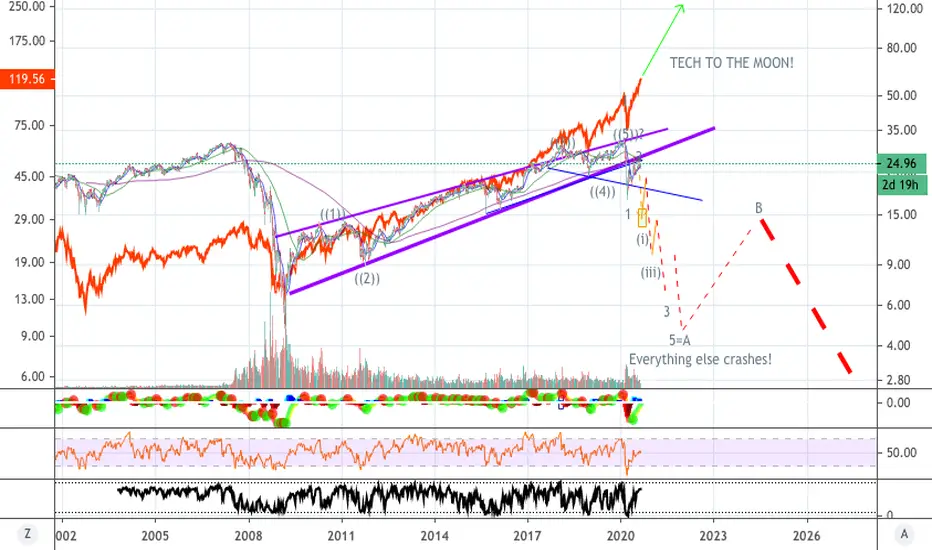
A most insane proposition!I'm not sure many can deny that we are in the most bizarre market the world has ever seen. So, is it possible that tech stocks and especially FAANG-MT will continue powering to the moon and beyond, while everything else crashes?! It's a wild guess but I don't think I've seen anyone draw up a scenario like this one.
(Warning: My downside targets on XLF are a real possibility. The XLK (in red) upside target is arbitrary and not based on any known theory except "up up and away!")
Good luck to everyone!
XLF trade ideas
Still not buying the cyclical rotation to financials theme Still under the 2009 relative low, so no I'm not buying the whole rotation to financials theme just yet.

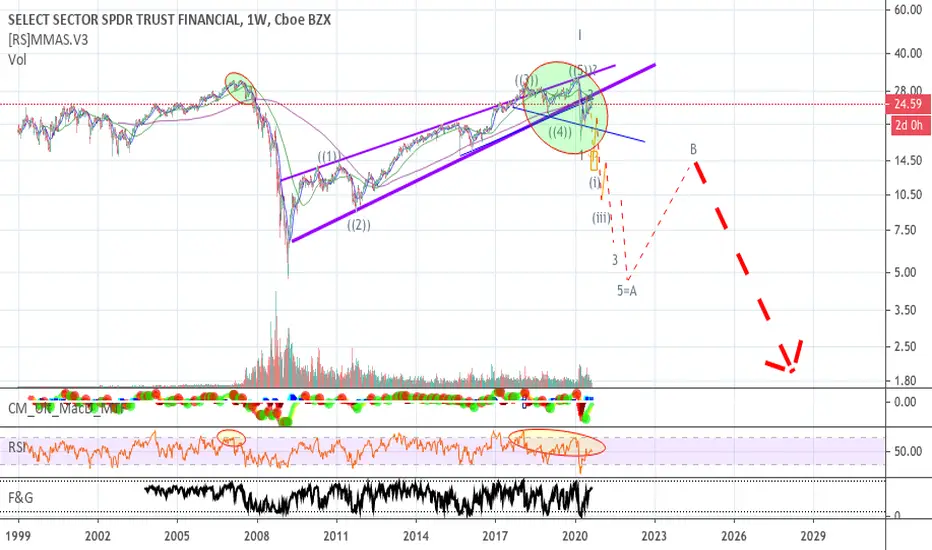
The Great System Reset?I will make one more attempt here to trace out the potential "super cycle" or "grand super cycle" bear market waves that I believe are still about to unfold. I am tired of the distortion caused by tech stocks in the S&P so will use the financial sector directly to try and map it out. Also, if markets truly continue to rise and disconnect from reality then I shall rest my case.
Basically, what I see now is the government and central bank stimulus since the onset of covid sparked an unexpected "new wave" of bullish market players. I don't know exactly who they are, but suspect many of them are associated with the Robinhood application that suddenly exploded with new clients since the March market bottom. This explosion of "belief" in the power of the FED to always "save us" should complete the second wave of the bear market (or final 5th wave of the bull market where technology is strongly present). With respect to market psychology, this should also complete the "complacency" (or Euphoria with respect to tech) stages of market, so the next stages will be the deep declines of the anxiety, denial, panic, and capitulation (although tech may still have a few strong rallies).
If the FED had only started supporting markets since covid arrived, I could see the case for a new bull market. However, they have already supported the market since 2008, including the "repo" efforts prior to covid, and their efforts have done nothing but create an illusion of success, all reflected in the stock markets. In reality, unprecedented levels debt have been created in every asset class imaginable, and wealth disparity is now wider than any time in American history.
Therefore, I still propose that in order for the socio-political and economic structures of the world to restore balance, we will have to eventually endure a near or complete system reset. Although the stock market has still been holding up, we already see huge red flags of the breakdown of these structures in a wide number of global societies (ie. BLM, massive delinquencies and business failures, civil unrest). The market represents the collective sentiment of its players and for some reason, different than other times in history, there remains an extreme sense optimism and infallibility out there. It is like a large group of "dreamers" spurred by the FED's actions truly believe the we can disconnect from reality, accumulate debt and never deal with the real issues out there.
Most traders are looking at the short term picture, but what I write about is a great global upheaval that will take at least a decade to resolve as shown in the charts. It will encompass a multitude of both enormous bull and bear waves, and possibly even complete shutdown of the stock markets.
What can we do?
Well, first look out for each other in the real world.
Second, cash will likely be better than anything.
Third, if you are a bubble player then go ahead and try to ride these rallies.
Forth, ride the bear waves with me if you have the courage. At this point it seems like a folly, so I do not suggest, but heck I try to ride them anyway.
Good luck and I'll begin creating some more shorter posts if we ever start trending down again...


XLFBreakout from consolidating zone last week. Like this as long it stays in channel and above prior resistance.


XLFLooks like more room ahead. But take profits on short term calls as it challenges the longer term trend line.

ABC BullishTop 10 Holdings
BRK.B - Berkshire Hathaway Inc Class B14.21%
JPM - JPMorgan Chase & Co10.99%
BAC - Bank of America Corp7.25%
C - Citigroup Inc3.89%
WFC - Wells Fargo & Co3.38%
BLK - BlackRock Inc3.31%
SPGI - S&P Global Inc3.15%
AXP - American Express Co2.30%
GS - Goldman Sachs Group Inc2.29%
CME - CME Group Inc Class A2.22%
FInancial sector should still have roomThis is not a good sign for TLT. The chance for S1 decreased meaningfully. Long financials while be prepared for S2 and S3.

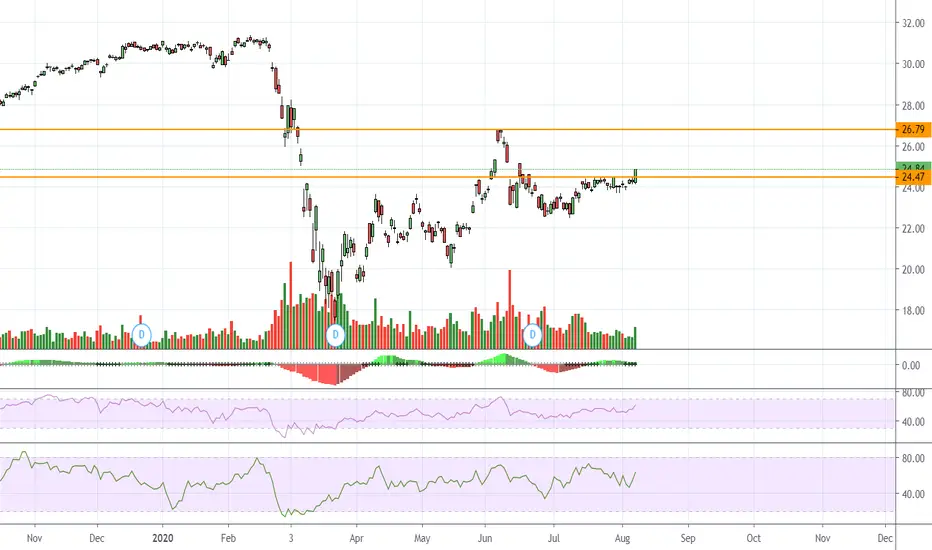
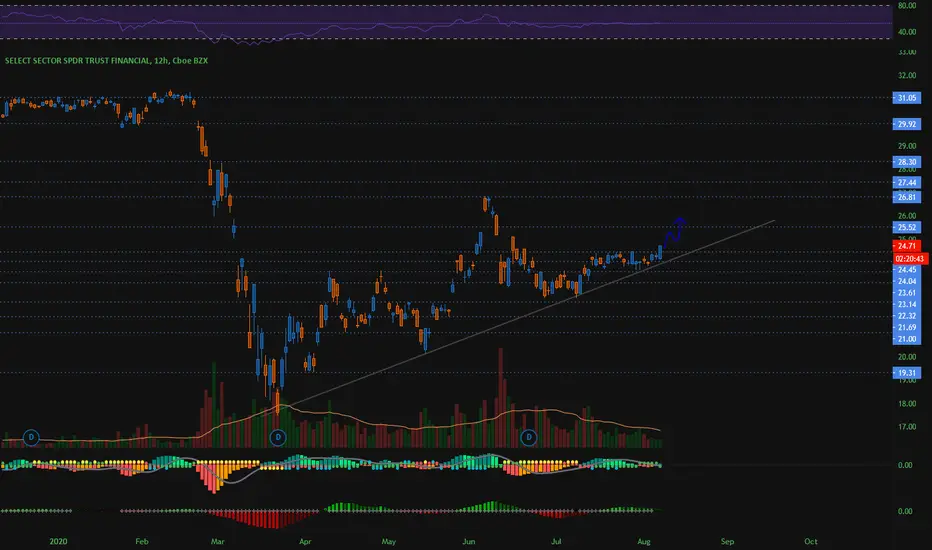
XLF daily - a swing trade candidateXLF had a double breakout last Friday (Aug 7 2020) with above average volume . RSI is strong but MACD is negative for now. The plan is to buy it around this level with a stop around $24. Expect to hold it for about a month with $3 to $7 gain per share if it goes well.


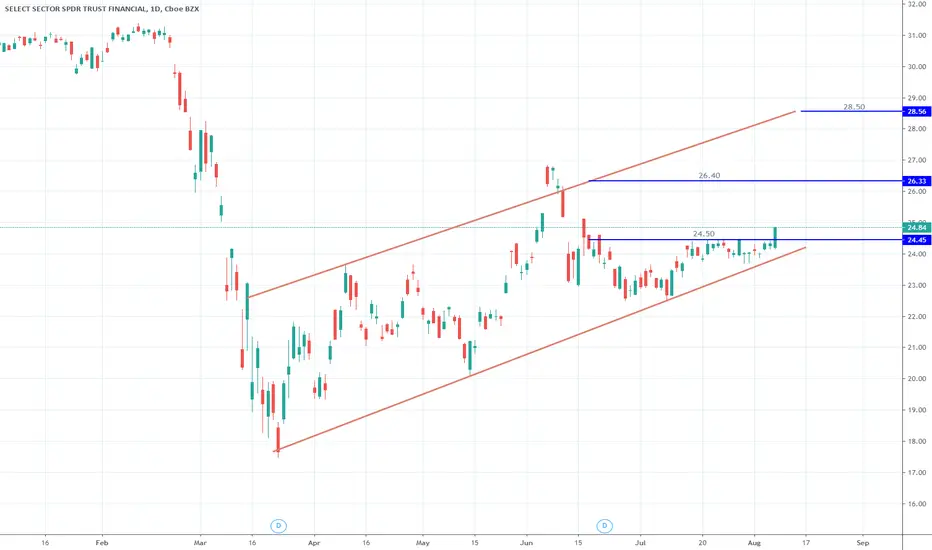
$XLF Financial Select Sector SPRD Fund ETFFinancial Sector ETF. Break of 24.50 opens 26.40 and even 28.50 targets. Break below 24.00 on the daily will trigger a stop loss.
XLF Gap Fill?FA makes no sense, but price action shows XLF wants to fill the gap. Volume better step in or this is going to make an ugle negative divergence with the RSI.

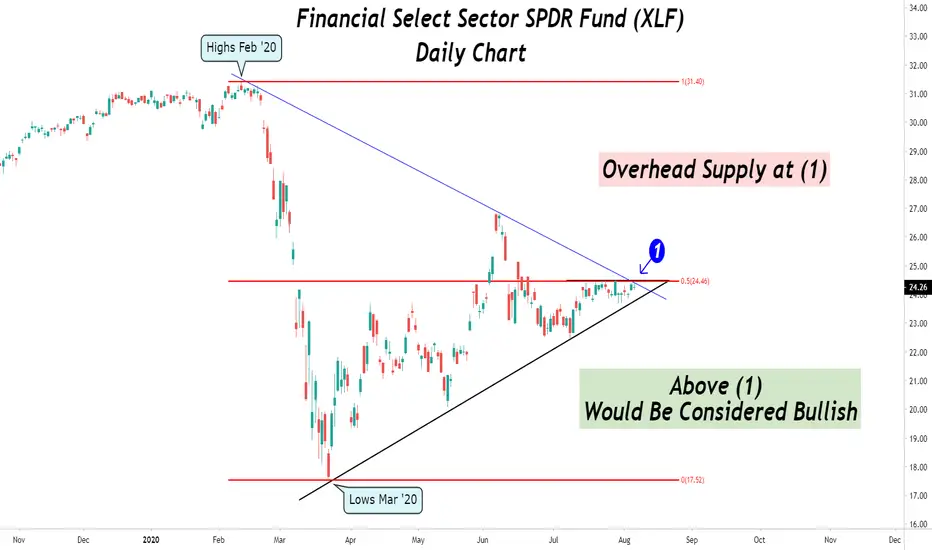
XLF members underperform. The Financial Select Sector SPDR Fund (XLF) has drastically underperformed the broad market since the COVID-19 March lows (second to Energy XLE). Yesterday XLF gapped up closing at 2433.50 +0.70% whilst holding above its medium-term moving averages on the Daily time frame. During this morning's U.S. session we are seeing weakness amongst the XLF members.
Here are the top 10 XLF drivers and their performance at the time of writing.
Berkshire Hathaway Inc. -0.17%
JP Morgan Chase & Co. -0.1%
Bank of America Corp. +0.04%
Citi Group Inc. -0.66%
Wells Fargo & Co. -0.49%
BlackRock Inc -1.18%
S&P Global Inc +0.04%
Goldman Sachs Group Inc +0.09%
American Express Co -0.63%
Marsh & McLennan Cos Inc -0.62%
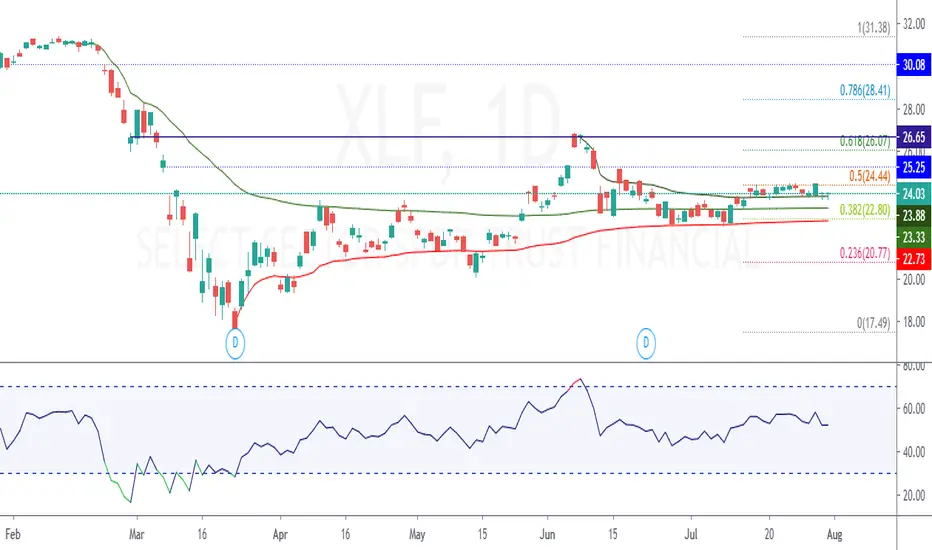
Although the fundamentals are not looking great, from a technical standpoint, we are now at a crossroad (1) where overhead supply is dominating today's performance. What happens at (1) will most likely determine the direction for the medium term. In order for the bulls to have the upper hand they will need to overcome twin resistance at (1), sloping trendline and 50% fib retracement, taken from the February highs and the March lows of this year. A break below the black diagonal support line would trigger further downside pressure.

Potential (LONG) Pattern XLFThis is not an investment advice.
Trade at your own risk.
Do not trade money you can't afford to lose.


XLF closed nicely above VWAP from recent highs $30 comingSecond innings of upside starting. Looking very good with limited down side and more upside. $26 and moves on to $30 targets
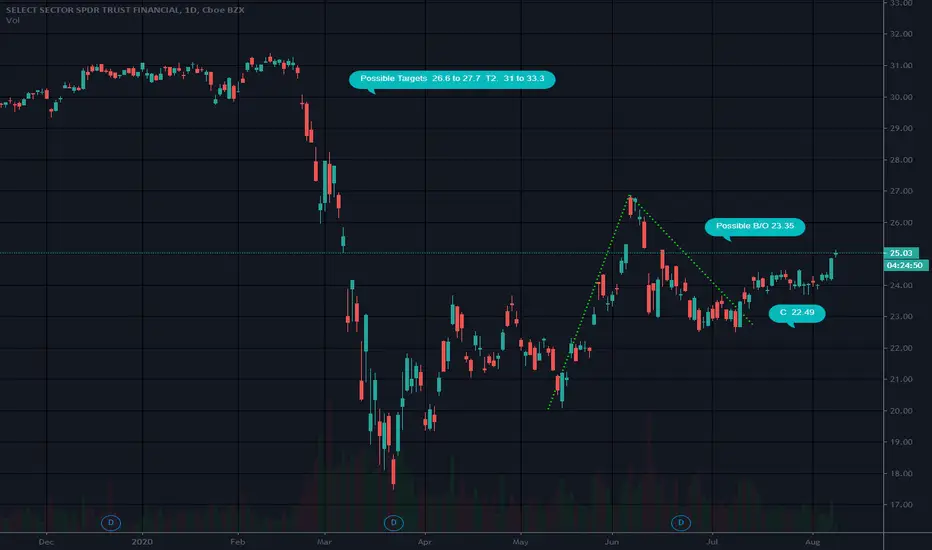
Banks setting up for another major leg downWhile in the short term it looks like XLF could rally back up to 26-27 if price is unable to significantly get above that level another large leg down in XLF in likely. Breakout above or to the right of the green box would invalidate this. The current bear market rally could last until the end of the year.
