Who shall win the Great Plains Battle?Within a week of taking control of the Great Financial Wall, bears drove the bulls far into plains territory where a riveting battle has ensued. I have to show some respect and commend the bulls who have stood their ground the past few days despite having lost the protection of the wall and being ravaged non-stop by the bears and fire of the Phoenix (VIX). However, I must warn that if the bulls lose this battle as well, then it would no longer be bravery but nearly suicide to try and press on. The next evolutionary stage of the Phoenix is of such power it may not have been seen for over 90 years, a fire that could obliterate everything within days. Also, today, the Great Wizard (central banks) fired a spell that worked many times to empower the bulls (rate cut), but it utterly backfired.
In light of the coronavirus and today's FED failure, I now see the possibility that the bull market is finished, so I added a new potential trend line down to XLF sub 12 by 2021.
Please stay safe and good luck, friends!
XLF trade ideas

XLF - Fed rate cutThe obvious beneficiary of a rate cut is financials. I thought about XLF calls Friday afternoon but bailed because I didn't know why the market rallied. Silly me, of course it's the Fed. SHould have known since they burned me in 2008.
Expect XLF to rally into teh Fed meeting in March.
Also, way oversold like everything else, lol.

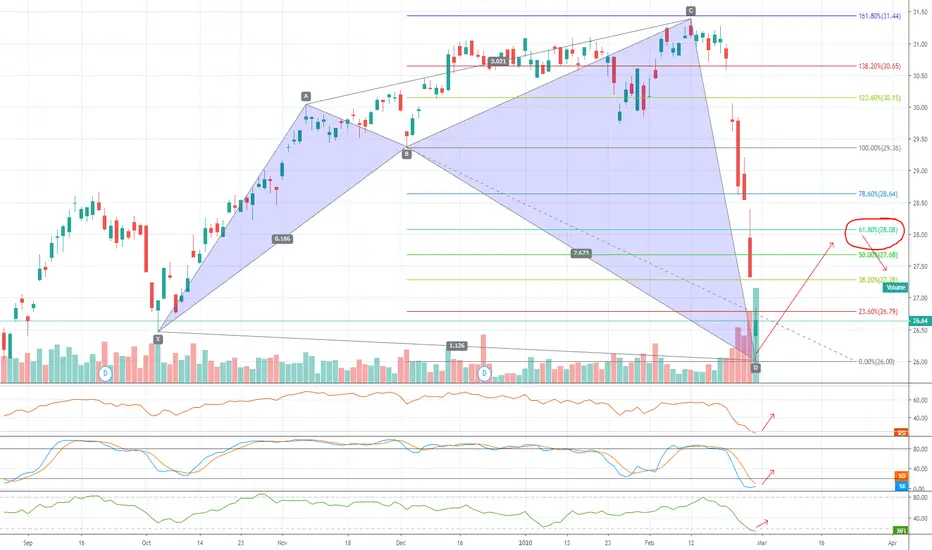
$XLF Oversold but still showing weakness Bounce to 28 then dropOversold indicators, closed below Oct bottom , long-term weakness identified maybe due to more cutting of interest rates but now expecting bounce to 0.62 fib then falling again (+10%) or can be extended to 1.32% fib then drop but its not unlikely
Bears have full control of The Great Financial WallWell, well, folks, for those who have been following my narrative about The Great Financial Wall (GFW), it shall be told now that, after months of battle, the bears today took full control of the GFW. With much pain, they thwarted the final stealth bull attack (ie. repo injections) which almost allowed the bulls to reach the other side of the wall.
However, as it stands today, the greatest bears who have withstood years of loss and humiliation are now standing atop a solid defensive structure and an array of arsenals at their disposal. Now they await the arrival of their brothers and sisters to begin the march into the corrupted heart of the market to finally clean it out and bring the economy back to reality.
No doubt, there will be many battles to be fought as the bulls still have strength south of the wall. However, the bears have gained the most important ally, the Phoenix of fire (VIX), whilst the magician of the bulls (central banks) have perhaps one more trick up their sleeves. Unfortunately, they wasted all their ammo jacking up the market instead of actually saving the economy.
Good luck to all! To my friends who do not know how to play a bear market, please stay in safe assets. To my bear brethren, stay strong and watch out for the short squeezes which will inevitably come!

Will the bulls breach the great wall of resistance?This week's market movement has been baffling. The bears were on the verge of striking the bulls down from the great wall of resistance, when they suddenly returned, with great stealth and silence in the wee hours of the night, to retake a central place on the wall.
Have they succeeded in using guile and deception to defeat the bears once and for all? I think it is possible. If the wall of resistance is completely broken above, then this fantastic wave iii of 3 rally that bullish dreamers have been talking about for years could become reality.
However, I continue to favour the bears. When I observe this chart, the gaps all the way up tell me that bulls have been using deception and manipulative (under the table) techniques to climb the great wall (since way back in the Fall). Once the deception is exposed, the bears, who stand together in strength, should perhaps stand a chance at victory.
If it is these underdogs who win, the defeat for the bulls will likely be beyond shocking, as their ranks are ripped out from beneath their feet, thrown back into the gaps from which they climbed, and the (VIX) Phoenix rises to even greater heights to breathe its fire on these scattered few who choose to remain.
Good luck trading this wild beast of a market, friends.

WARNING: Bear attack from the Great Financial Wall in progress..As of Jan 23rd, the bears are no longer just holed up along the Great Financial Wall. They are striking back and have dealt a powerful weekly defeat to the bulls this week, assisted by their most powerful ally who has risen from the ashes and breathes fire from the skies for the first time in two years: The VIX Phoenix.
Weekly Diary:
Jan 23: Bulls hold up
Jan 24: Bears win first round
Jan 27: Bulls begin to high tail from the wall in a panic. Bears give zero ground the entire day.
Jan 28: Bulls put up a counter attack and inch back toward the wall.
Jan 31: After a few days of fighting, the bears achieve their first decisive weekly victory, smashing the bulls' multiple counterattacks.
The bears now have control of the wall *and* the Phoenix.
This is an imminent warning that we could witness a drop worse than Feb 2018 very soon.
Technical Note: You will likely see this in the media in a few days, but my system has already detected both the titanic and hindenberg crash warning signals. Please take heed.

XLF - a more bearish countI posted a bullish chart for US financials a little while back with it looking that nothing can hold stocks back at the moment. With the recent events of this virus (I live in Asia) I thought I should include this more bearish outlook. While it suggests that this ticker has finished a 4th wave correction and will now climb onward it also suggests that the next correction might be a biggie. As always, any count is just a possibility and while a few weeks ago I was firmly in the bullish count this Corona virus is perhaps presenting a "black swan" that hasn't fully revealed itself yet. The R1 and S1 are the yearly pivots.

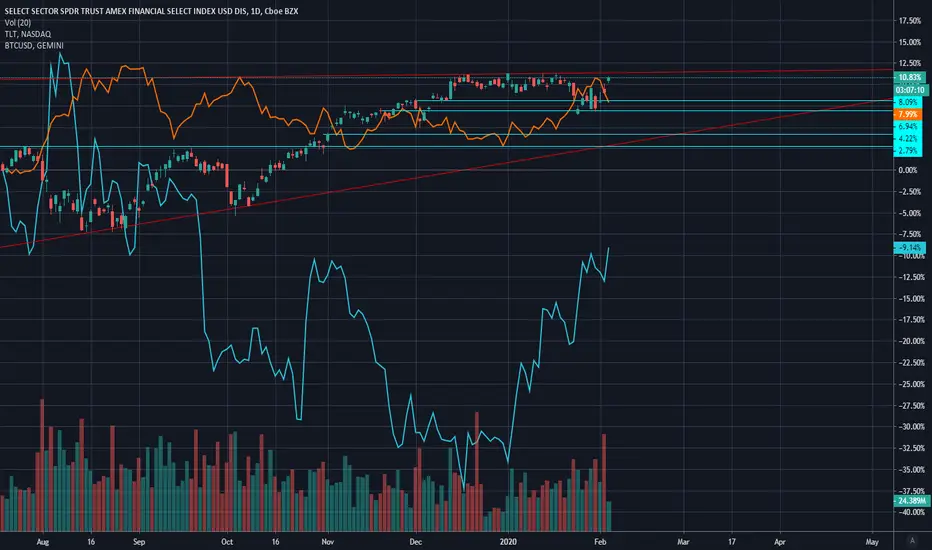
XLF Ascending Triangle Level of Resistance $31Purely a speculation on my behalf that XLF will reject again at this $31 level like it has done several times thus far. Alternate plays would be $TLT to the upside. Bitcoin USD showing risk off action that leads me to believe the selloff isn't over and the reversal from the big upside at the open this morning for the QQQ, etc. also leads me to believe that we're not done with the selling. (I'm wrong more often than I'm right on the timing of things so may not happen immediately). But I've been using bitcoin as my compass here lately and it's been an accurate direction indicator for the broader market. Goodluck.
These are my opinions only, and not trading advice.
02022020 Palindrome Day - Continuation or Mirror of Past Decade?XLF has bounced off its previous high of 2008. (Followed by the 2008 financial crash started by the housing market).
Breaking above this will trigger an investment spree the likes of which we have never seen before.
Dropping away will likely trigger a reversal in trend, and the end of this spectacular growth for perhaps a decade or more.
We will know by the end of February 2020.

FINANCIAL SECTOR LEAD BEAR FOR THE MARKETTICKER: $XLF
Financial sector is the clear lead bears for the market. We rejected hard at 31.10ish level and broke key support level of 30.46. In my opinion, this is the reason why $SPY pulled back hard.
We had huge bear volume on Friday and if we break the low of Friday (30.20), look for a continue dump to fill the gap under 30.13.
Can the bears dethrone the bulls in the short term?

The Great Financial Wall Stands StrongThe Great Financial Wall that I posted about last time has withstood 6 weeks of bullish onslaught and held. Daily MACD has turned negative and, with respect to fractal intervals, I believe the bears that have survived and remain on the wall are about to fire back. Completely exposed and with little ammunition left, I'm afraid the overly confident bulls will high tail from the wall as fast as possible or risk being slaughtered.
Going short. If you don't know what you are doing, stay out and safe. Good luck friends.

The Great Financial WallIt is with great sadness that I write this today. However, my humble opinion is that the assassination of Irani General Suleimani is not some singular event in the space-time continuum that can be ignored. In fact, it will, in all likelihood, eventually make it into the history books as a parallel to the assassination of Archduke Franz Ferdinand leading up to WWI. I am not supporting this man's crimes, rather condoning the thoughtless method in the which his demise came to be.
Some may see President Trump as a courageous new figurehead who will bring greatness to America again. However, I see him as the mostly untold story of Hercules, a strong and insanely courageous, but *wreckless* man who will destroy decades of peaceful global collaborative progress built by generations of predecessors.
Today, I throw myself out there again and predict that the next Great Wall will not be the Great Wall of China, nor the Berlin Wall, nor the Steel Wall of Mexico, but the Great Financial Wall that may not be surpassed for years to come. (Mind you, Trump has already greatly humiliated and angered two of these aforementioned great cultures during his Presidency and no good will come of that either.)
I am officially switching my stance from neutral back to short based on the important trigger event that unfolded on Friday. Now it's time to patiently wait for support levels to drop out.
Good luck and stay as safe as you can, friends!

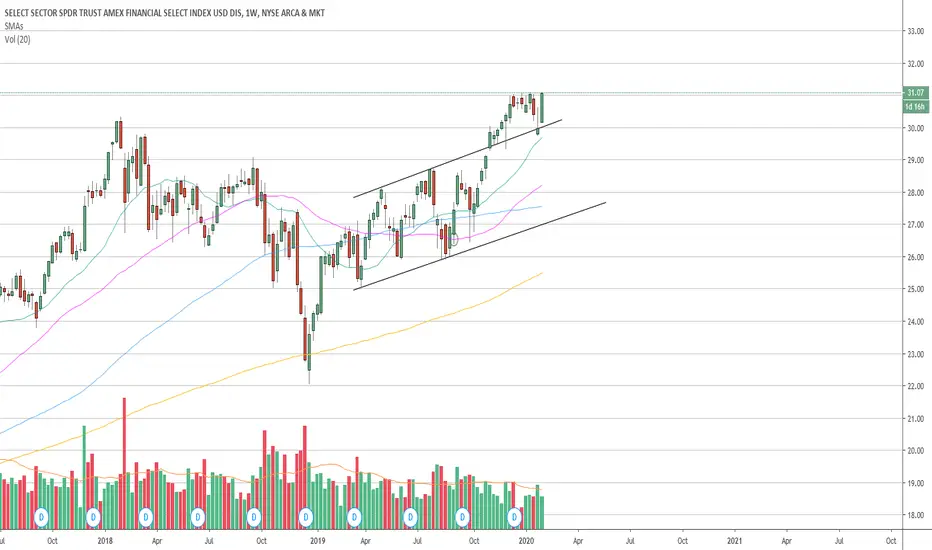
Picking Up SteamThe financial sector is ready for another move up. After giving the appearance of weakening last weak, it bounced off of support and is now trending again, and ready to break out of Darvas Box with a little wind to it's rear, though it does have to contend with some earnings this weak from within it's ranks.

XLF Pre Bank's earnings This week is all about the finance sector with the Major bank's earnings. 🤓
Tuesday 14.1- JPM, C, WF ⏳
Wednesday 15.1- BAC, GS, PNC 💸
Thursday 16.01- MS, SCHW 🙃

TRADE IDEA: XLF FEBRUARY 21ST 30/32 LONG PUT VERTICALWith the financials at a multi-year double top, a bet that financials announcing next week will disappoint in the aggregate in this easy/easing rate environment.
Metrics:
Max Profit: $96/contract
Max Loss: $104/contract (which is what you'd pay to put this on).
Break Even: 30.96 versus 30.69 spot
Notes: Max profit is realized on a finish below the short strike at 30; anything below the break even of 30.96 is a winner; and max loss is realized on a finish above the long at 32. A basic risk one to make one, which is what I like to see out of these directional shots.

XLF **Who Knows? Bull Flag, but Possible Break DownBull Flag in place but looks like breaking down.
Projection: Monday - Breaks down to at least 30.50 and then it will be interesting to see if it breaks further down for a lower low or higher positioning into the JPM earnings. Your choice here. But banks look pricier than they have for a while. But if they impress look for a breakout from the bull flag.
Goodluck
XLF

XLF - US Financials- bullishI started looking at this chart to see where I thought this thing would start a decent correction and ended up with this super bullish count. I do have a more bearish scenario that suggests that the price action from January 2018 is a much longer 4th wave correction as part of an expanding flat or some kind of flat correction and we can still expect a C wave down. However, if this sector can break through the sizable resistance of the 31 high of 2007 (it has already in fact....just) then maybe this count is not so far fetched after all.

$XLF Short at 30.8 Targeting 28.5 Bearish PatternBearish red candles expected to be followed by long red candle

XLF breeches ATHsWell, the market bulls finally did it...
They breeched the financial sector's 2007 ATH at 30.97.
In my opinion, this means the most rapid bear market scenario has been eliminated as we can no longer label the high as a 'C' wave from the 2008 bottom. Furthermore, the rise from those lows should now form a 5 wave impulse, which does not look complete yet.
That said, my original bullish and super cycle 4th wave patterns are still possibilities. Ironically, I think breeching the ATHs also opens the door to an even more EXTREME bearish scenario in which we could be approaching a grand super cycle finale in the months ahead. Albeit, this would be a slower bear market, but extremely devastating as it could last for more than a decade.
Time to sit back for a bit and see what might unfold. Right now it seems that that ATHs was sort of an iron wall, even though it was breeched. We shall see if the market can really push past with force soon.

XLF v. TNXFinancials hit an all time high this week and made it back to the highs that occurred before the 2008-2009 crash. Note that ten year treasury yields have done nothing but slide over that same period of time and are now at the greatest spread they have been against XLF over the last 11 years. Many think yields are going up but the smart money seems to be telling a different story. The bounce in yields since the lows of the year looks to be a dead cat bounce. The 1.95% area has marked an area of resistance now for some time. If yields start moving down and we head into a recession this are gonna get real ugly. If Yields rise and give equities a run for their money stocks will also fall. The excesses in financial stock from 2007-2008 are finally back. Yeah people will say that they have underperformed but an over 600% gain from the bottom over an 11 year period is hardly a shabby return. Don't see how we could go much higher from here. RSI looks exhausted. Something has to give. Look out below!

Financials Could Be The Fuel Needed For Stocks to Move HigherXLF is threatening to break out above the 2007 highs and begin a new leg higher. In the short term it's safe to expect a bit of a battle up here

XLF- Double Top? or Breakout? SPY in Trouble?Well, isn't this interesting? After 12 years the XLF has finally managed to get back up to the old highs set back in 2007!
Double top is exactly the same (to the penny) as 2007, as shown, just before the financial crisis for 2007-2009 happened.
If we look at history the XLF began to crack and break down in 2007, giving us clues about the rest of the stock market a few months
before the market began to collapse.
The XLF diverged and led the market index down before other traders began to recognize that the market index was in jeopardy.
So now the question is, will it happen again?
More importantly is this a double top in the XLF and do we begin to set up a major market correction?
Or- Will the XLF break through the resistance overhead at the high and still continue up?
How likely is the XLF double top high to get broken next week?
Well, very seldom does any chart show a breakout on the first try after touching the exact resistance line of a former high.
We would expect a pullback very soon, if not immediately next week. Most breakout charts ,at a minimum, would pullback for a while
and gather more energy by consolidating at lower levels before attempting a breakout (if that is in store).
Think about a cup and handle pattern.
Otherwise, if the double top is in play, we could see a huge sell off down to the green zones below as shown.
Forecast is lower for the XLF going forward, with both bullish and bearish patterns... down to gather energy at a lower level for a future breakout in the bullish scenario,
or a complete failure and falling back down to the green buy zones way below... either way, both ideas point down!
