XLF Important Financial SPDR.. Suddenly Dropping SharplyS+P Select Spider ETF XLF,
a basket of the most important financial stocks,
including money center banks have been dropping sharply in the last week.
Somehow big money always seem to know and then exit ahead of material adverse news.
It's really uncanny, and it's been that way since the 1920's,
as they were early getting out then ahead of the great stock market crash of 1929.
By the way XLF, the financials are reacting to the Italian bank debt crisis,
one can obviously see the genuine concern for contagion risk is very real.
THE_UNWIND
XLF trade ideas


$XLF bullish credit spreadNew bullish credit spread on XLF (financials) for OCT 12! Not this Friday. Solid movement this morning in the market and financials is starting to show strength. Decided to take this move out two weeks to allow for the bottom to confirm and some bullish movement to occur.
Entry 27.79
Max profit 28.50
Break even 28.14
0.38:1 risk/reward

XLF coming into a Trend LineI like the idea XLF is coming into a trend line but whole lot of price value is still below. I know the chart doesn't show the volume profile but 27.41 has to hold. Any lower and we could really see a market correction.

broke my stop and go - at the beginning it broke out the long term resistant (blue arrow)
- it did not continue going up, instead it came back and re tested the supportive line (yellow horizontal line)
- broke the support and also my stop (the lower horizontal line
- it did not continue the downward trend, instead it rebound right away with a long solid candlestick
lesson
- not chase at the top of the breaking out candlestick, it would be a hard time if it retraced
- how to set up an effective STOP?
- buy at the failure of going down is safer than buy at the top of breaking out


XLF threatening trend Change as of todayKRE confirmed the trend break down yesterday. XLF is the next domino to crack. I have little doubt we are about to see nice correction in the financials sector.

XLF long call + daily breakoutYesterday, I opened a few positions in the 3x financial bulls etf symbol "FAS" as I though it was at a better value than technology. To my surprise, the banks exploded higher in making a new daily high. With this new high, I believe the financial banks will begin to perform better and attempt to reach all time highs. I bought the January 18th long call option strike 28 for 1.49$. I believe the XLF stock will reach 30$ and I should be able to sell this option for (.51/1.49)=34.2% gain. I will be interested in locking in some profits with a sell call when the stock is near all time highs. I bought 7 contracts, so I am risking 1,043$ and looking to make atleast 250$ up to 340$.

$XLF - We're getting to the end of it. Well... the beginningAfter this week, it's fair to say I deserve to get another bearish post in before I look too much like a nut head who's dead-set on seeing a major market correction. & Before I give anyone the benefit of the doubt about this post - over the past 11 days (I think?), $GS has been on the longest losing streak in history (money.cnn.com). 12 or so trading days ago (Aug 28th, I think) - I called the top. The top for 'a while', at least (stocktwits.com). The past year (123) trading day highs about to cross below the (252) trading day lows is obviously a bearish cross, but whatever investors see with their own moving averages / TA they might see as a contrarian indicator, so I think there's enough bullishness left to see another head-fake before that all comes to a (deep) end. Another reason I say that, & really the main reason I started looking into financials entirely before becoming completely bearish was $PFG. The black bar pattern to the right of the chart is $PFG's current trend, compared to its trend in 2008 before the 2009 crash. Like $AIG, $PFG is another investment / insurance company (little less than half in size) that I've used as a leading indicator for the performance of financials. Right now, it's on its last leg to making a few upward moves before really starting a downward spiral. I'm sure you could say the chart is a coincidence, & the fact that both $XLF & $PFG both merely reached their ATH's back from 2008 (Fib used on chart is based on highs / first drop in 2008) before starting the downtrend. But the market doesn't lie, & trust me I've tried to spot any bubble / crisis potential / whatever we're looking at but in an overall picture, Goldman Sachs is looking @ a picture perfect clone of what it saw in 2015. While $PFG is reflecting back on it's 2008 trend. & while $XLF isn't acting the same as it did in 2008, but I think the ATH's being near exactly alike is something I really can't get off the back of my mind of what the market thinks for the long run.
$PFG Link -
$GS Link -

XLF - Bullish (a little bit)Financials have certainly busted out these last few days and I have put up 2 EW counts that might suggest it could keep going over the coming days and weeks. The problem I have however is knowing whether the 2018 correction is actually over or not and it is just as possible that the correction takes another turn and continues down. If the red count turns out to be correct then in the spirit of alternation we could expect a deeper correction yet as the 2nd wave was only shallow. Lots of interesting things happening in the financial markets. Never a dull moment.

$spx $spy $xlf Nice breakout in the financialsNice breakout in XLF the resistance has now become support.

XLF I'd be very very cautious taking swing longs in financialsXLF sure looks like it is at range highs and channeling sideways. I am leaning bearish from here intermediate term. Also, this weeks weakness drawn down by insurance. All the hype over the hurricane has traders bidding down the insurance companies.


Inverse H&SOne way see the price of the Financial Sector performing over the next few weeks. A breakout out could easily jump to 29.79 without much overhead resistance. However, these Inverse H&S patterns like to back test breakout points as support so I could see a zigzag price movement the way up.


XLF Hitting ResistanceI took my XLF off the table from $27.04. Was only looking for a move to the downtrend line. It is hitting some overhead resistance.

XLF - Falling wedge breakout buying opportunity**Market Structure**
-A falling wedge has broken
-Due to the price rise going into the wedge as well as the downward sloping nature of this wedge, that gives is a solidly bullish bias
-The overall markets have been bullish and we could see the tide lifting all ships higher
**Trading Tips**
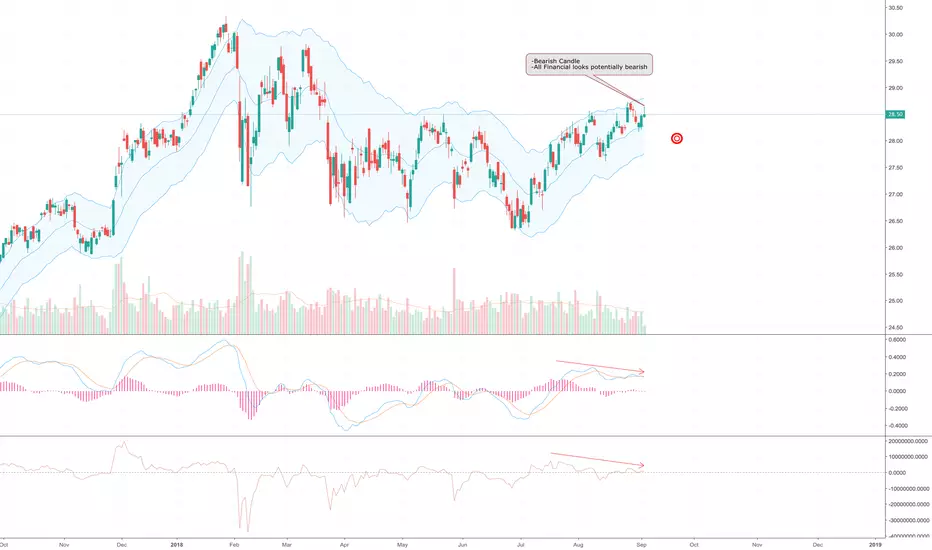
-A bearish pinbar has formed on the daily so we may see price drop lower in the near term
-I expect the overall bullish picture to stay intact, and so any push lower may be met with strong buying
-If price does drop lower to retest the upper channel of the falling wedge, using this price action information (bullish trend, bullish pattern breakout), it may create a high probably buying opportunity
**Trading Ideas**
-This ETF could be purchased outright right now for a decent risk/reward setup
-If you are willing to wait and see if price falls it may offer a better entry point, at the risk of missing the trade if it doesn't fall
-The price target is the peak of the pattern @ $30 so different ways to get long this trade are to buy the stock outright, create a synthetic long position buy selling a put and buying a call at the same strike(about 1:5 leverage), or selling a vertical put spread for a defined risk trade

XLF: Long Financials Long Financials, big banks posted strong earnings across the board two weeks ago. Didn't get much attention with analyst citing the flattening yield curve having negative effects on future earnings. Chart recently broke out on weekly and daily time frames. Got a little trigger happy with tech and healthcare this month, looking to be more defensive. Bought Aug 10 29 calls the other week, also adding equity for the long run. Also looking at JPM and BAC.
TA:
MACD(12,26,9): On the daily chart MACD signal line crossed early in the month of July, and still gaining momentum. The weekly is much more interesting, as I've been waiting a couple weeks to enter this, weekly is showing a bullish signal for the week as of today.
Momentum: Just turned positive on the weekly chart and making higher highs/lows
Trendlines: XLF is breaking out of a downward facing wedge, waited for the confirmation to add equity. Currently trading in a very steep channel on the daily that most likely won't hold, but the weekly MACD plus the trend breakout is very attractive to me.
Added 100 shares at 28.359
First target 29.00 Second 30.00

XLFBanks appears to have begun a break out, I'm looking to break middle BB on weekly for trigger then stop out. I like the 5ma on the weekly beginning to turn up in coordination with the could as building support.
In all, Friday showed some potential signs of a pullback/consolidation (I try not to guess based on one day though), so will look for that middle BB to give clue.
Second consideration, attempt to find single banks with relative strength on the assumption that the XLF takes confirms break out.
Just some thoughts.
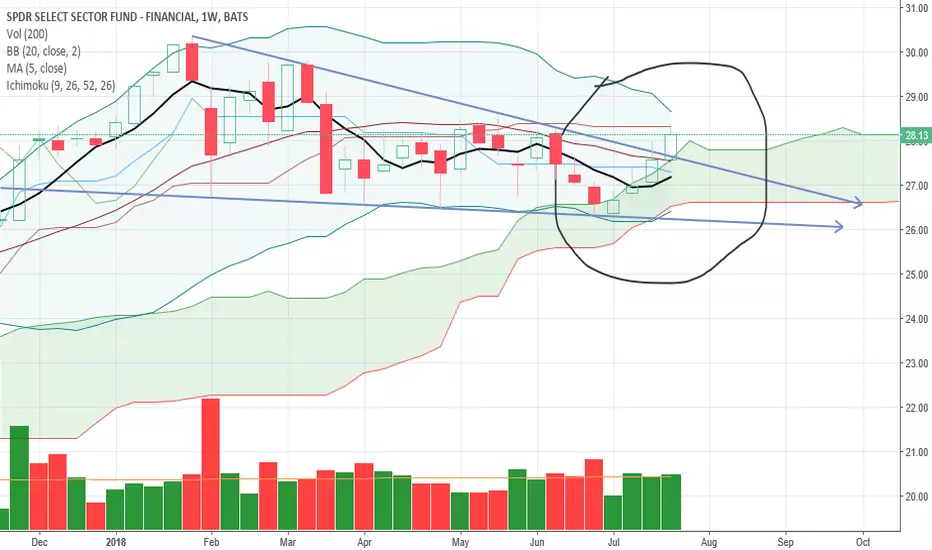
A wedge, which when breaking generates a bullish projection.Two purchase signals with the ichimoku indicator, an ascending wedge that projects the 31 usd when breaking, and the koncorde indicating the interest on the part of institutional ones. Draw your own conclusions about it. twitter: @charly1030284

XLF..Falling wedge. Pivot point support at trend line support (wedge pattern) held nicely.. now fib level in play and trend line resistance to deal with... Its all going on !!

$XLF - Move up comingFisher TF cross targeting 1.618 fib extension, which should lift the market. Possible upthrust coming. Seeing lots of blocks in banking individual names and XLF
