sector ETF charts show the blow off and distribution of topsSchwab put out a great letter yesterday showing various ways to value the market. While the market valuation has improved slightly, on most measures, the investors are getting very little bang for the buck. I enjoyed the article very much and will give the link here if youre interested
www.schwab.com
In summary, market aint cheap.
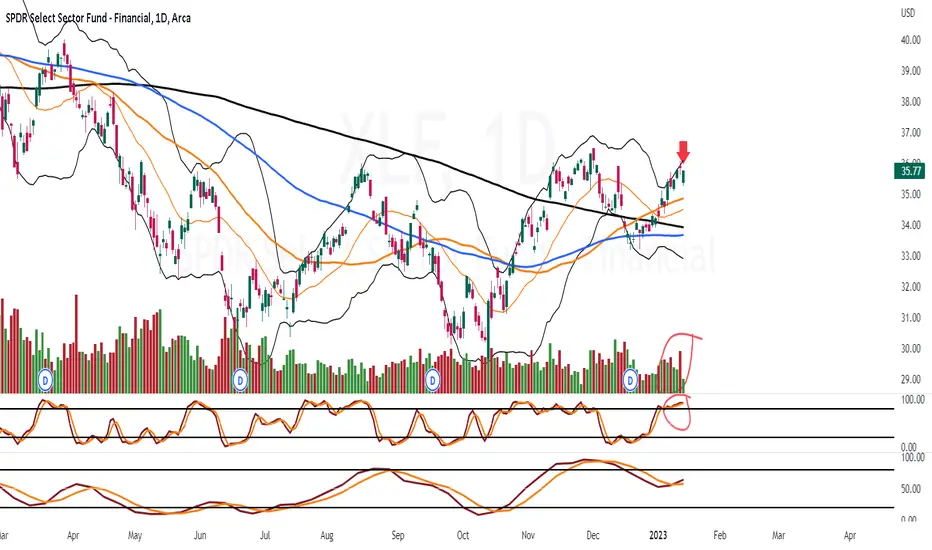
Scanning over the big picture views on 8 etf sectors, boy do those charts look scary. I really cant believe how so many "picture traders" believe the market has bottomed and will go straight up from here. I get it. Draw a line, good enough right? But after living through this learning experiment for almost 20 years, this dont look right.
sure, maybe the fed and gov can devalue the dollars and therefor make the number go up on everything. fine, so be it, im a metal bull anyway. I got stock, fine. but thats not real wealth. its a robbery. borrow all u can and let them devalue.
but as far as trying to find value, its not really on sales. half of would be fair on the growth stocks. half off would be fair on the value stocks too. alot of stocks have 2% or 3% earnings yields and growth in future dont look so hot. 1 and 2 year notes are paying near 5%. this market doesnt make sense.
I remember in 2006, 2007, 2008, things were confusing too. I honestly believe the big boys prefer it that way. Institutions and whales cant unload if the public doesnt stay in long enough anyway. Bear market rallys are just reloading rallys for the big boys.
If you dont learn to do your own homework, youre just going to get used and abused.
XLF trade ideas

XLF Breakout watchI like the breakout pattern that has formed here. Long entry would be on a break above the recent high. Targets would be the fib retracements above. Needs broad market support on the breakout. Not interested any more if price falls below the box. May trade the ETF itself or instruments within it.

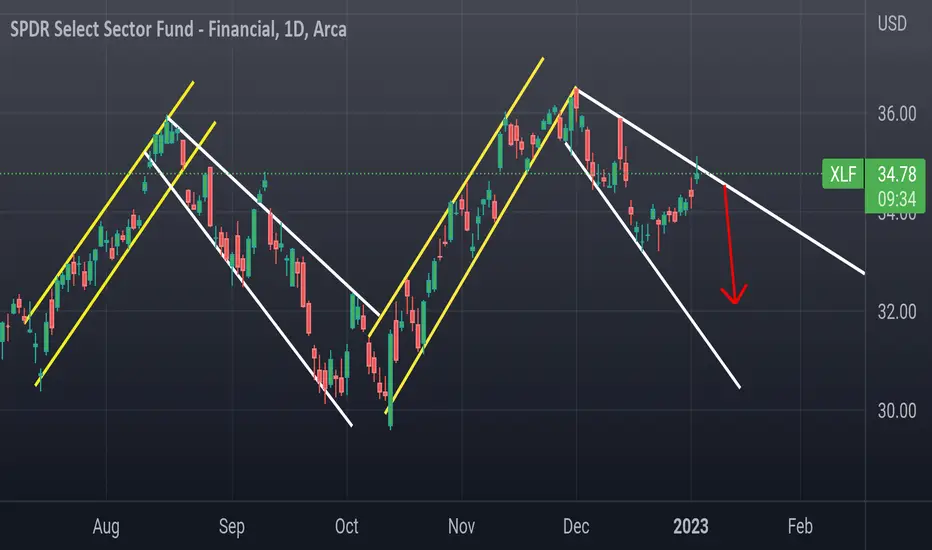
XLF time for the rising wedge to uncoverXLF is in a huge rising wedge from a bearish point of view and in an inverted Head and shoulder pattern from a bullish point of view. Unfortunately for one side, this will move very fast and strong on one side. The information from this chart indicates it will be down, or to say on the proper way there is more chance to drop than to go up from here (this is a game of probabilities, not certain things, and we need to bring odds in our favor to earn money while trading). We had 6 tries to breakout out of the neckline to be able to say we are going to an all-time high, financials break it and trigger a very powerful and tradeable bullish pattern Inverted Head and shoulder. But each of those 6 times the XLF pump above the neckline was smashed right away which is a sign of a bearish market. Same as on QQQ, if there would not be a set sell signal before, now it is for sure.
Volume does confirm price action. Volume on the downside is much stronger than on those trying to break out.
RSI after huge bearish divergences is now dropping to neutral territory.
MACD is ticking lower and lower while the MACD line will very likely today fall below the signal line signaling short opportunities.
Overall: financials just don't have the power to cross the neckline and start a massive bull move up which btw would bring the whole market up. WQe can't go anywhere with the financial sector, just can't and won't. Therefore this is a very crucial time for the market as a whole. If XLF really drops from here drops below the trend line and triggers a rising wedge pattern it is over for bulls for some longer period of time.
If bulls don't wanna see the nasty and red first half of the year they need to start buying right away. The chances for breaking the rising wedge are much higher than the neckline due to the mention above.

XLF rising wedgeCorrection coming for the banks Late FEB , Early March.
Daily Candle bearish engulfing with some increase in selling pressure

XLF D1 - struggling to break resistanceXLF D1 - struggling to break resistance. Not a short signal, but worth watching if there will be developing selling pressure on lower TFs, and then reassess. The implied volatility is low, so maybe buying a put to limit risk to the upside.

XLF is on its end of the pattern, it's decision time!XLF daily - there is more and more chance that financials will drop hard and fast. It just can't break out of the neckline and continue it's moving up. It pops twice in the last 3 sessions above the trend line but those trend lines are very strong resistance areas.
XLF is close to decision time, meaning will bulls win and this will trigger an inverted Head and shoulder reversal pattern which will confirm we had a bottom or this will be broken down from a rising wedge, a very bearish pattern. It is close to the end of the pattern and there is no more place for decisions. Therefore break will be imminent on one side or the other.
Inverted SHS will mean the possibility for testing ATH while rising wedge testing of lows.
I would stay aside until we get perfect confirmation.
Both RSI and MACD are pointing for a big drop due to their negative bearish divergences.
Prepare popcorn because there will be fireworks soon!

$XLF financial sector fund $XLF broken out of C&H continuation setup. being NDX and S&P and break out point with

Financial ETF May Be Attempting a BreakoutFinancials have quietly outperformed since the summer. Are they now getting ready for a breakout?
The first pattern on today’s chart of the Financial Select Sector SPDR Fund is the series of higher lows since early November. That could suggest buyers are willing to pay incrementally higher prices.
XLF has pushed against a slightly rising trendline that runs along the highs beginning in late May. This combination of overhead resistance and higher lows may create the potential for a breakout.
Next is the $30.97 level. It was a major long-term high in 2007 (before the financial crisis) and early 2020 (before the coronavirus crash). Prices tested and held this support twice last year. There was also a failed breakdown in October.
Third, the 50-day simple moving average (SMA) had a “golden cross” above the 200-day SMA on December 22. Is the longer-term trend getting more bullish? In the shorter term, the eight-day exponential moving average (EMA) has also climbed above the 21-day EMA.
Finally, consider fundamentals and the macro situation. Banks have increased provisions for bad loans. They’re also fighting a deeply inverted yield curve and recession worries. What happens if some of those negatives start to lift?
Standardized Performances for ETF mentioned above:
Financial Select Sector SPDR® Fund (XLF):
1-year: -12.42%
5-years: +22.54%
10-years: +156.95%
(As of January 31, 2023)
Performance data shown reflects past performance and is no guarantee of future performance. The information provided is not meant to predict or project the performance of a specific investment or investment strategy and current performance may be lower or higher than the performance data shown. Accordingly, this information should not be relied upon when making an investment decision.
Exchange Traded Funds (“ETFs”) are subject to management fees and other expenses. Before making investment decisions, investors should carefully read information found in the prospectus or summary prospectus, if available, including investment objectives, risks, charges, and expenses. Click here to find the prospectus.
TradeStation has, for decades, advanced the trading industry, providing access to stocks, options, futures and cryptocurrencies. See our Overview for more.
Important Information
TradeStation Securities, Inc., TradeStation Crypto, Inc., and TradeStation Technologies, Inc. are each wholly owned subsidiaries of TradeStation Group, Inc., all operating, and providing products and services, under the TradeStation brand and trademark. TradeStation Crypto, Inc. offers to self-directed investors and traders cryptocurrency brokerage services. It is neither licensed with the SEC or the CFTC nor is it a Member of NFA. When applying for, or purchasing, accounts, subscriptions, products, and services, it is important that you know which company you will be dealing with. Please click here for further important information explaining what this means.
This content is for informational and educational purposes only. This is not a recommendation regarding any investment or investment strategy. Any opinions expressed herein are those of the author and do not represent the views or opinions of TradeStation or any of its affiliates.
Investing involves risks. Past performance, whether actual or indicated by historical tests of strategies, is no guarantee of future performance or success. There is a possibility that you may sustain a loss equal to or greater than your entire investment regardless of which asset class you trade (equities, options, futures, or digital assets); therefore, you should not invest or risk money that you cannot afford to lose. Before trading any asset class, first read the relevant risk disclosure statements on the Important Documents page, found here: www.tradestation.com .

XLF monthly new bull market or fake out?XLF (banks) monthly was in a huge symmetrical triangle which start to form at COVID lows and January did break out which is bullish while the month finished slightly above last month's high which is also bullish as we got higher highs and higher lows or trends.
However, volume is not the best and doesn't confirm too much this price action much as on break out of this kind of pattern volume should be much bigger or this could be just a fakeout or dead hook which could cause a major drop in whole banks sector next several months.
Therefore price needs to move on, and close above the January high. RSI is neutral and still has a lot of places to move up. MACD histogram is ticking smaller and smaller while lines are trying to cross and to support up move. From the bearish point of view, if XLF drops below the trend line this will just be a Bear pullback and will get a big and nasty sell signal.
Consistent trades assess there is more possibility to drop from here due to the fact that reports from banks weren't the best at all plus the real estate market start to fall which could also be negative for banks. After this Hype about the FED pivot, interest hike and etc, fundaments will arrive again and banks will likely drop.

XLF daily - sell signal-XLF daily what a move today. First, we gapped down at open, then we fall, then buyers came in and drive XLF to 0.6% up, but then the price hit major resistance, neckline, and drop hard on strong volume. The last hour's volume was a huge drop and the volume was like 4 hours before together. When I checked 1 H candle I can say retailer traders played the whole day with fire and in the last hour of trading big boys sold out.
The whole week's volume is smaller than 20 day's average which indicates this is still only a bear market rally and is not confirming price action.
However, XLF is above all significant MA which is bullish.
RSI is in the mid-overbought territory and is ready for a correction.
MACD also doesn't confirm this price move and has negative divergences which are bearish, the same as RSI.
Overall: Banks are lagging in this show and in this move-up, due to their pretty bad financial report. Also, most banks said they expect a weaker next quarter which can't be too positive for the sector r as a whole. XLF formed a big shooting star reversal pattern at the top of the leg which is very bearish. RSI and MACD are confirming moves are not strong same as the volume.
Therefore Consistent trades put a sell signal at XLF.

XLF daily - bounce from support, but more chance to drop nextXLF daily is forming two major patterns. Both are in their extreme. The bullish one is inverted Head and shoulder and the second is bearish and its rising wedge. Price did fall this week as we expected in the last analysis and did find support at 20 and 50 days MA and at the trend line and did bounce from those lines.
XLF is above all major MA which is bullish.
Volume is at 20 days average and does not confirm price action too much.
RSI is neutral at the moment but in case XLF continues to go up it will very likely form bearish divergences.
MACD histogram is, however, ticking lower while the MACD line and the signal line are very close to cross which would be very bearish.
Overall: XLF is closer to breaking the rising wedge and continuing to fall than to breaking out of the inverted Head and shoulder and going towards ATH. If XLF continues to go up will meet with resistance very fast at around 36 areas.
In case it falls below 20 and 50 days MA and this trend line, XLF will for sure drop very hard to at least to BigRed and then likely towards the red dotted line as the first major support.

Xlf (Financials)36.00 is the brickwall!
Bearish harami setting up here.. watch for a double top into a correction.

XLF daily - decision time coming soonXLF indicates two possible patterns, bullish and bearish.
For a bullish option it develops a large inverted SHS pattern, while for a bearish one it develops a rising wedge.
The last trading day last week price gaped down due to bad financial reports, however the day closed in the positive with solid volume which is bullish.
The RSI is in overbought territory and indicates a likely correction, which is bearish.
MACD histogram is ticking up and both MACD and signal lines are above the zero line which is bullish, however negative divergences have developed which is bearish.
Overall: if the day closes above the upper blue trend line, a bullish reversal pattern inverted SHS would be triggered, which would be extremely bullish for XLF as well as for the entire market, because the market cannot go against the banking sector. Resistance would be the ATH area.
On the other hand, in the event of further negative financial reports and a drop below the lower trend line, a bearish rising wedge pattern would be activated and the price would certainly continue to fall. Support would be first the right shoulder and then the head of the pattern marked with a red dotted line.

XLF SpeaksXLF has broken downtrend, successfully produced a Gartley retest, and now closes just above the cloud, and just above prior swing high. Financials must be looking ahead to some respite in FED rate hikes, since they are sensitive to short term interest rates. Along with SOX, XLI, showing similar trend breakouts, this is encouraging for bulls.

Sector ComparisonToday is the end of the first trading week of 2023. What sectors are leading the pack and which sector is going down? Here's a 1hr ext chart comparison, with the tickerTracker MFI Oscillator set to 20, color coordinated with these 11 sector etf tickers.
XLF financials
XLRE real estate
XLE energy
XLU utilities
XLK technology
XLB materials
XLP consumer staples
XLY consumer discretionary
XLI industrials
XLC communication services
XLV health care
Do your own due diligence, your risk is 100% your responsibility. This is for educational and entertainment purposes only. You win some or you learn some. Consider being charitable with some of your profit to help humankind. Good luck and happy trading friends...
*3x lucky 7s of trading*
7pt Trading compass:
Price action, entry/exit
Volume average/direction
Trend, patterns, momentum
Newsworthy current events
Revenue
Earnings
Balance sheet
7 Common mistakes:
+5% portfolio trades, capital risk management
Beware of analyst's motives
Emotions & Opinions
FOMO : bad timing, the market is ruthless, be shrewd
Lack of planning & discipline
Forgetting restraint
Obdurate repetitive errors, no adaptation
7 Important tools:
Trading View app!, Brokerage UI
Accurate indicators & settings
Wide screen monitor/s
Trading log (pencil & graph paper)
Big, organized desk
Reading books, playing chess
Sorted watch-list
Checkout my indicators:
Fibonacci VIP - volume
Fibonacci MA7 - price
pi RSI - trend momentum
BBMC - bollinger bands
TTC - trend channel
AlertiT - notification
tickerTracker - MFI Oscillator
www.tradingview.com


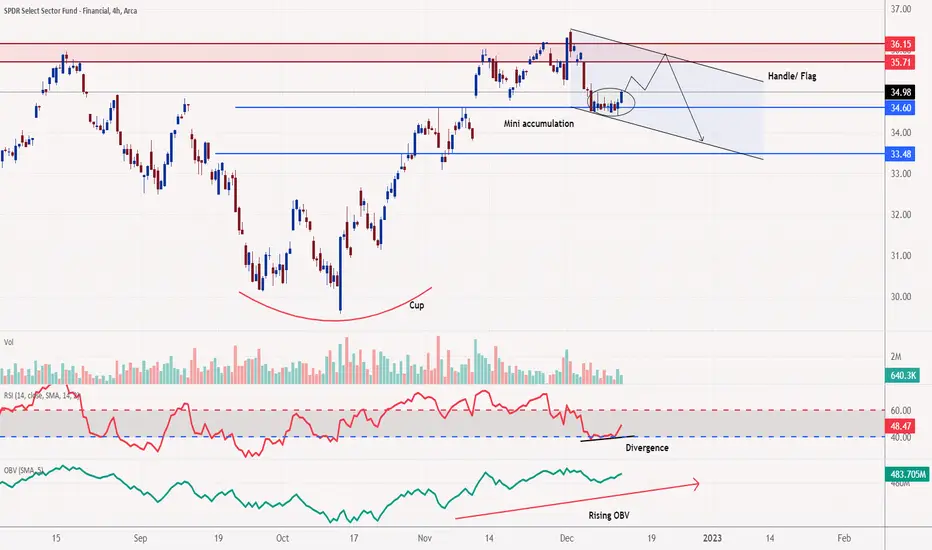
XLF - One more short-term upside. Mid-term potential bullXLF had a strong close yesterday night, and with the RSI showing bullish divergence, the stock may continue to rise towards the supply level at 36.00. Afterwhich, the potential sell-off may find itself at a support at 33.48, which potentially could form a bullish flag. Larger pattern saw a cup and handle formation.
XLF potentially headed lower to 26I think given the deteriorating macro environment there is a decent chance XLF breaks below 30 and heads to 26 in the coming 6-12 months.

$XLF: Sideways or down nextThere's a trend that is expiring in financials here, which makes me uneasy for the broad market. Within the next 8 trading days we can expect either a sideways move near the target here, or a drop back to where the last trend signal started @ $34.1. I'd keep an eye out for reasons to short the market soon, financials might be warning us of impending risk if price drops from here next week.
Good luck!
Ivan Labrie.

Triple Top Forming on XLF AMEX:XLF
Triple top forming on XLF, while price broke 200sma, it now runs into the 2022. resistance line that provided support in 2021.
Fib at 50% of 2022 high, highest MACD numbers in almost 18mths, RSI at overbought border, and tested resistance zone upcoming, current charts displaying to many negative indicators for upside profit

Financial recover soon?XLF which is an index of Financial Sector is currently retesting the top of 2007 (before Subprimes crisis) and the top of 2019 (before the Covid19 crisis).
Remember, a resistance often flip into a support when broken.
This may a very nice opportunity with a correct Risk/Reward ratio to play a bounce here.
Thanks for following us !
