XLK trade ideas
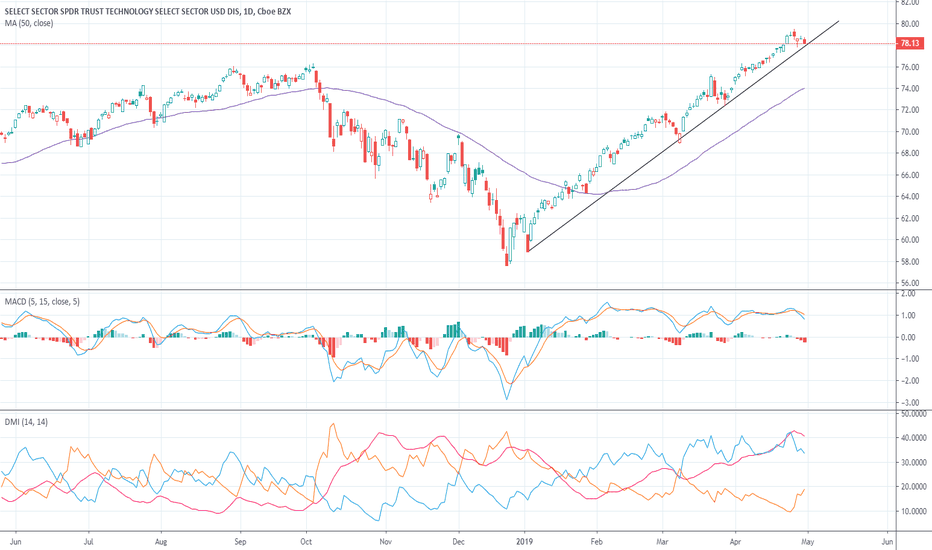
XLK Short Set-up - Uptrend break Confirmed by DMI and MACDI've been targetting XLK as a short candidate. It's 35% MSFT and AAPL at the top, with a host of other old-school tech giants dominating its members - very limited in momentum, growth names like cloud, Saas, Internet which would add risk to a short in this market.
Also,I like the 20% semiconductor exposure. Semis have obviously been on fire as everyone was caught off-sides trying to short their weak fundamentals, but INTC's report and overall exhaustion puts semis as a prime sector to short.
A break of the XLK uptrend would be confirmed by the two simple momentum indicators I track - MACD (with 5-15-5 setting) and DMI.
SHORT MRKT20/Mar/2019 12:49 PM
--
I would guess spy hourly catches cloud.
--
To Papai i said:
"if amd closes below $25 this week might I suggest taking some profit. Not saying to close position. - But I think you should have an if then plan. - If at the same time XLK were to get below 72 and close below I would personally consider that affirmation for profit taking
and if qqq gets below 175 Id take off even more"
--
XLF monthly with rsi rejection with single line analysis(either that or uniformity cant remember)
So if xlk goes...
--
Would think u would have wanted to buy puts this morning few weeks out while vol is still tamed
--
PUBLISHING FOR MY RECORDS. NOT RECOMMENDATION TO BUY OR SELL. DO NOT FOLLOW ME OR LET MY OPINION BIAS YOU. DO YOUR OWN DD.
The technology sector is very overboughtThe XLKs gapped up after breaking through the $70 - 72 resistance zone and are very overbought. The last four times that they were this overbought – last July, August, October and again in February, a meaningful selloff followed. Look for some consolidation or short-term profit taking.
My definition of 'overbought' means that they are trading more than two standard deviations higher than their twenty day moving average. By definition, 95% of all trading should be within two standard deviations of the average. If trading is outside of this range, either to the upside or downside, then there is a significant chance that the short-term trend will revert.
If they do head lower there may be support around the $72 level because it was the top of the recent resistance zone.
High Probability trade on SPDR TRUST TECHNOLOGY SELECT: XLKThe following are trades setup ideas in the daily chart for SPDR TRUST TECHNOLOGY SELECT: XLK
There are 2 distinctive dotted lines labelled as
1. AI's Resistance Line
2. AI's Support Line
If price action was below the AI Resistance line AND Retested below AND eventually closed below this line, the idea is to short and take profit at AI's Support line .
Instead of relying on 100% discretionary (human) trading, the robots will provide trade execution plan and it is entirely up to the human trader's decision to follow.
If Technology Stocks Are Rolling Over... Market is in TroubleThe technology stocks have been the long time leader of this bull market.
As the chart of XLK, the S+P Technology SPDR shows,technology stocks,
like the bellwether FANG stock, including Apple
have clearly rolled over on the charts, and are bearish in trend.
Today the technology ETF is down yet another 2 %
If the market's leading aggressive group, is in trouble,
A simple question...
Where is the leadership going to be found,
to propel this market back to all time highs ..?
Thoughts and prayer's to those suffering from the destruction of the California wildfires,
as well as to the California bar room massacre victims, and their families.
THE_UNWIND
11/12/18 945 AM
NEW YORK
XLK (Short)Whats up Traders
Tech section is taking a pounding -
I expect that the midterm elections are going to be horrible for the tech sector - Twitter, Facebook, Google, with lots and lots of threats at regulation on those companies.
Expect a big opportunity to score here with some november puts on this one.
Good Luck, DYOR
XLK ShortWhats up Traders
I posted on this one previously - if the day closes correctly, we will have broke support below a rising wedge / uptrend.
I love this ETF as a short or options put. Leading into the Elections - the tech sector going to come under heavy fire. . . Expect Threasts, Talks, Balks at serious regulation.
And that's my two satoshi's.
XLK Bounced off Short Term SupportXLK is in a very bullish momentum stage intermediate and long term. Short Term was whipped out this week but we managed to recapture it's low. This might be a continuation buy point. I don't like going negative for this quarter all in the first week of OCT. i can't call this a buy point.
$XLK bullish credit spread for this #FridayHigh risk bullish credit spread on XLK . Solid gap down in tech this morning, but not showing signs of continuation bearish. This is one of the set-it and forget-it spreads as we will let it go all the way till exp.
Entry 74.33
Break even 74.72
Max profit 75
0.78:1 risk/reward
More info at wingtrades.com


