Just a little bit to the upside for #Retail before bullish break#stocks #trading $GPS $KORS $XRT #Investing
XRT trade ideas

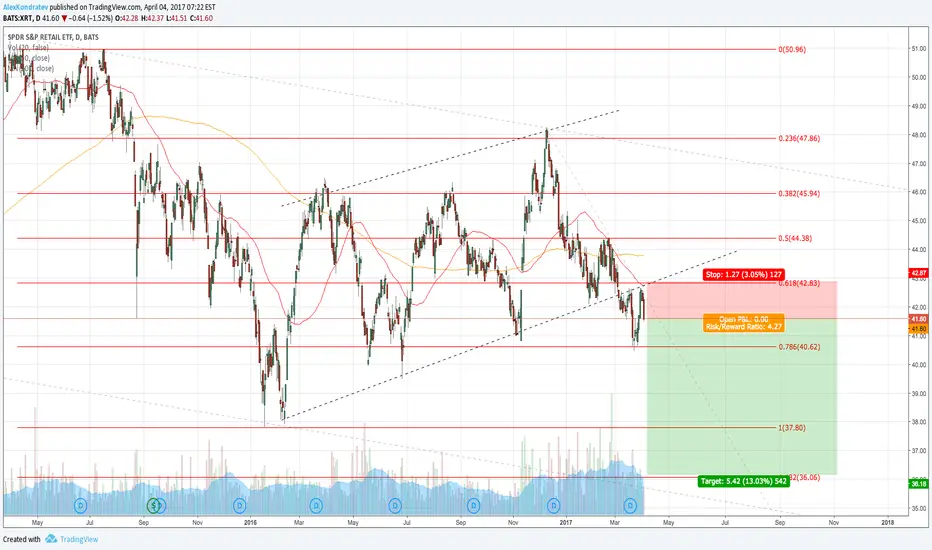
Retail ripping back higher XRTWe've seen a massive rip in retail with XRP in the last couple days.
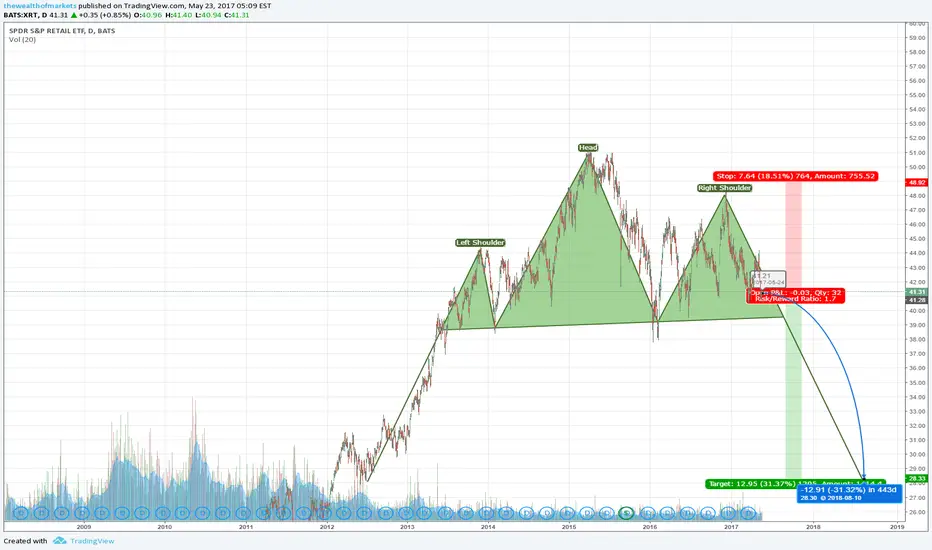
Finally breaking out of this 6 month long Head and Shoulders bottoming pattern. Breaking out over that neckine of 42 was the buy signal. Overall, retail is still in a down trend, and that downward trendline from 2015 highs is our target as well as where we should face profit taking and resistance. It is also coincidentally the 200% measured move of the head and shoulders pattern. Those technical levels always work out despite what the nay sayers may tell you.
THE TRADE:
Long over 42 (head and shoulders neck line)
Target 45 (measured mvoe of head and shoulders)
Stop under 42
We want to be buying the dips on this rip until we reach our target.

#Retail still holding the gap-up, this is a positive sign ...#support/resistance overhead @ $44.31. $XLY $GES $KORS

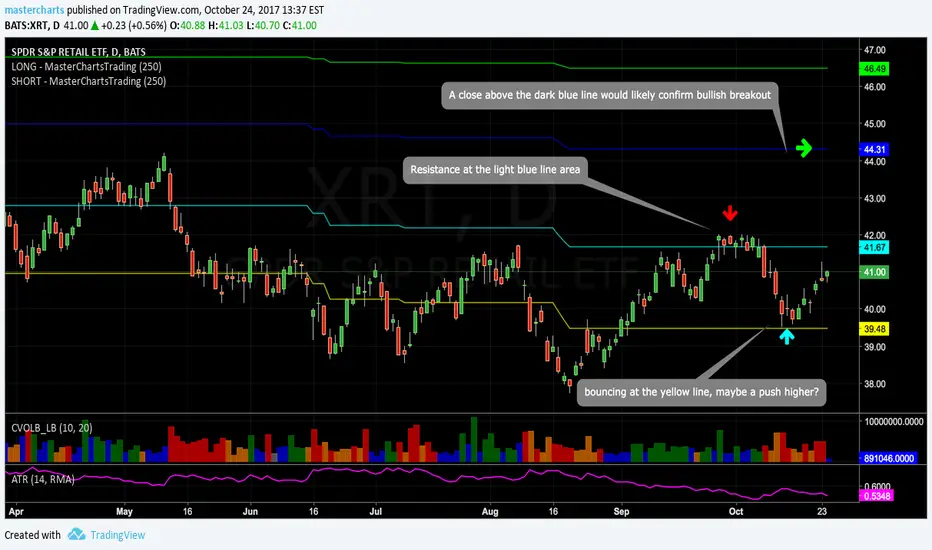
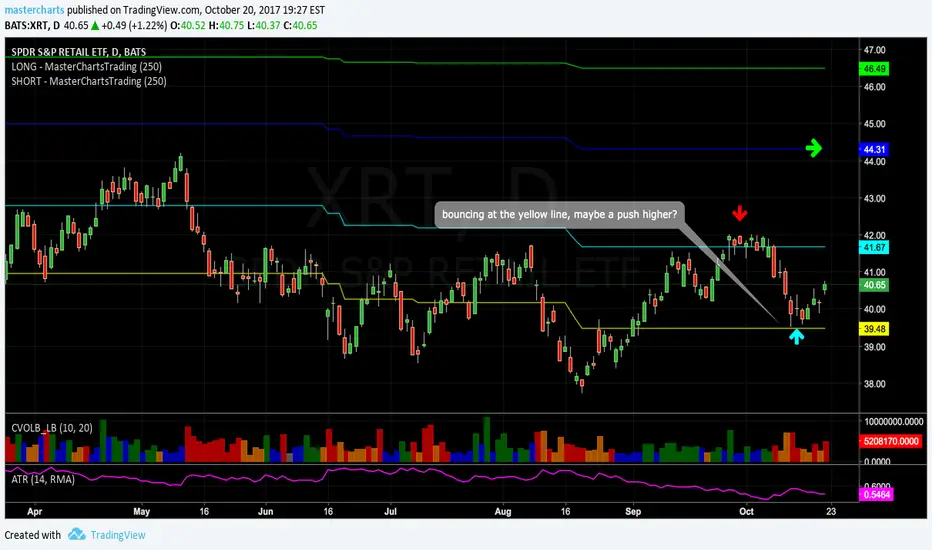
#Retail gaps up towards 1st resistance. A break higher?..Easy support/resistance lines. Break above blue line likely = bull market. $GPS $KORS
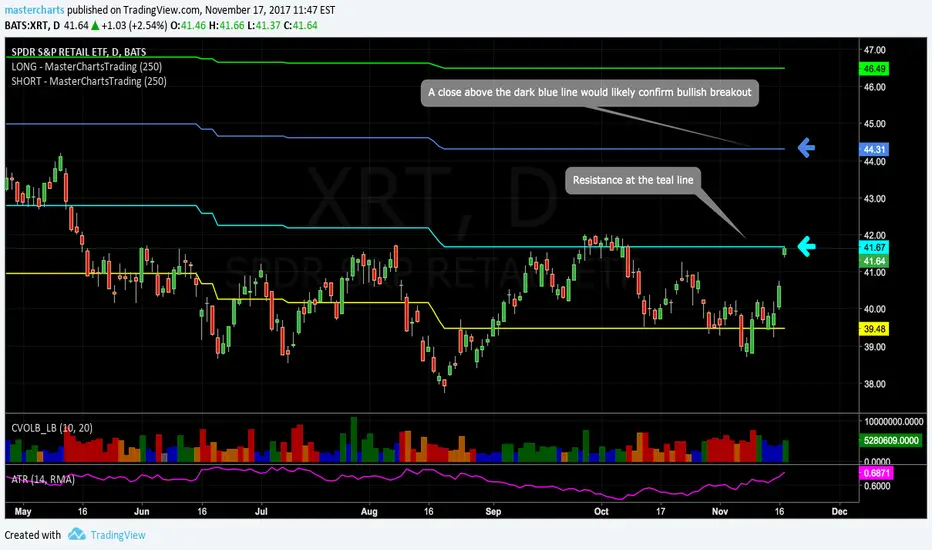
$XRT is looking promising..A close above the dark blue line would likely flip $XRT into bull market. $GPX $AMZN $KORS


XRT 37/42 Strangle updateOn August 10, I sold the 37/42 Sep 15 strangle in XRT, about 19 delta strikes for 0.65.
80% IV Rank and 26.6% IV. The following week I closed the 42 call at 5c for no fee.
The 37 put remains, and the share price looks like a good spot for it to bounce upward from here.
Today the XRT is up the greatest % of the sector SPDR ETFs as investors do some bargain hunting following the past few days of weakness in the major indexes.
Ideally I could let the put expire worthless...

XRT! Buy support or short the breakdown?Retail might be setting up for its time to shine.. what do you think?

Short PutsXRT has an IVR of 70%, $39 strike put is offering 1.69% ROC in Sept, with 73% chance of success.
Sold Sept 15 $39 put for $.66/contract.

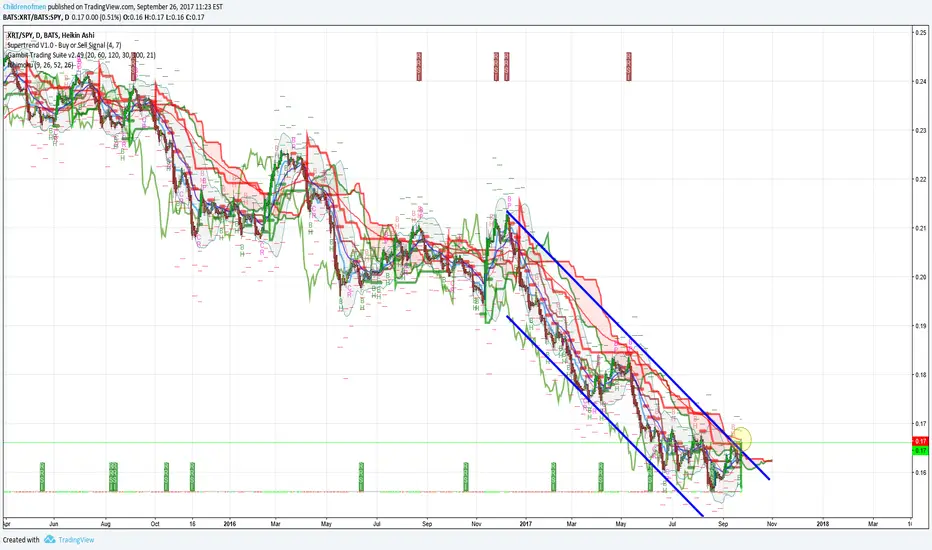
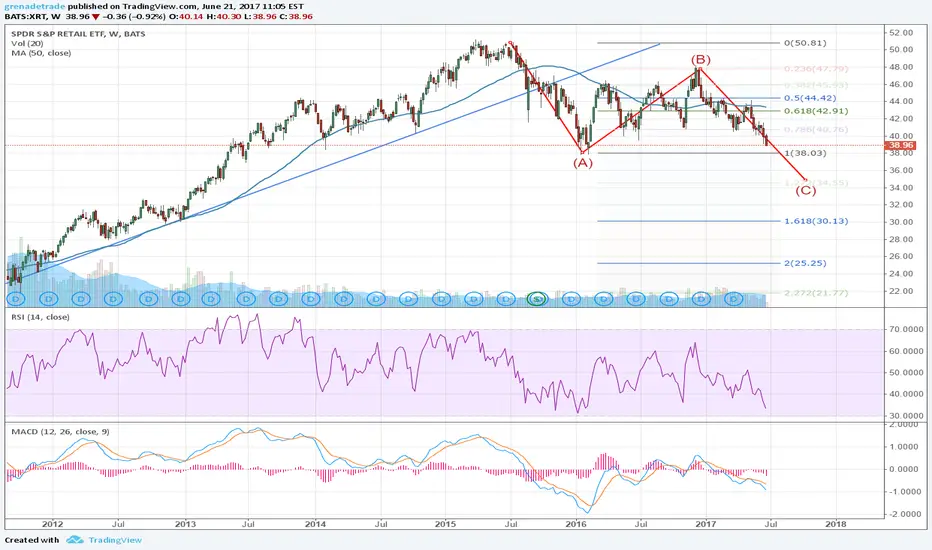
Retail in Corrective Wave, Looking For Support at $38 $XRTRetail ($XRT) Weekly: After breaking below a long term trendline support back in late 2016, Retail ETF $XRT has been in a ABC corrective Elliot Wave pattern. We see that in the very near term, it will look for support in the $38 area, which was the low and end of wave (A) as shown in the weekly chart below, moved up to the 0.786 fib level before starting it’s final wave (C) downward, which we’re currently in. It may get support at $38 but if that fails to hold, it’s projected to go down to around the $35 level and completing this corrective wave. Now, this may turn out to be more than a corrective wave and turn in to a longer term motive/impulse wave, but it’s too early in the cycle to see at this point which way that’s bound to go, whether to the upside or to the downside. Technicals show a bit more room left to the downside at current conditions.
Retailers and XRT are going to sell sharply on poor economicsI am very bearish on the United States economy. Retail data has been sliding lower and I expect that to get worse before ti gets better. Plus, on aggregate, one company seems to be taking all the business away from the rest. The others will collectively drag down the industry as more and more consumers switch to online shopping.
I am bearish on XRT and going short and have an extensive article on this .


$XRT Until there is real M&A in the areaNeeds to be serious action unleashed in this entire space.
Nothing but a Dewey Whackem, & Howe sector ...

81% probability trade on XRT (Put Ratio spread) High probability trade on XRT with no risk to the upside. Max profit at $41 our break even at $39.85.
The trade:
Sold Two (-2) 41 Puts for every one (-1) 42 Put for a credit of $0.15 (per contract).


US Retail sector - Head and shoulders patternUs retail sector have been making a top (Head and shoulders pattern) from 2013, we are close to see the outcome.
XRT trouble not overretail is in a whole lot of trouble. Rejection of the 200 SMA weekly all but assured for now.
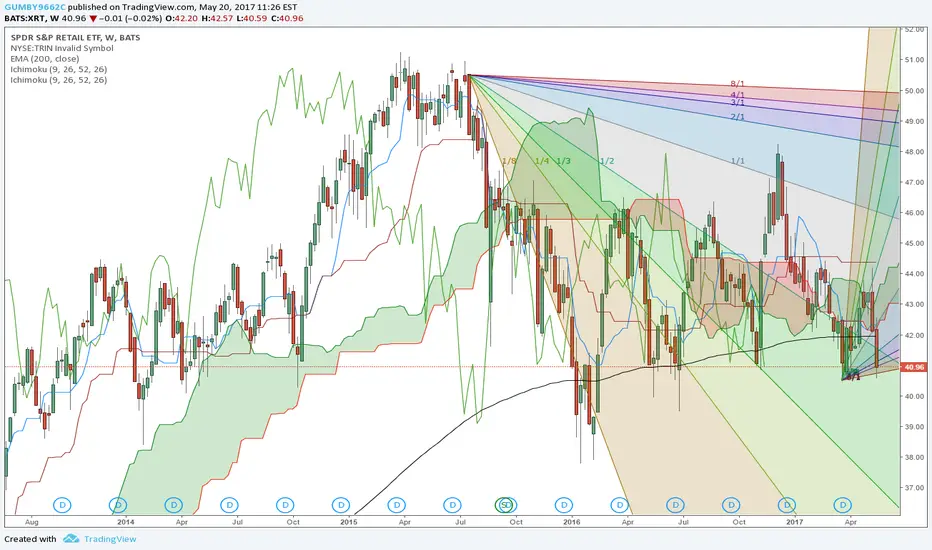
Short-Term Upside For Retail?The SPDR fund tracking S&P Retail has been trending up for years. Lately the industry and fund have been on some rocky footing. Currently the fund is at a potential key support level with value to the upside. The projected future movements are highlighted below based on technical indicators.
When we take a look at other technical indicators, the relative strength index (RSI) is at 36.0704. RSI tends to determine trends, overbought and oversold levels as well as likelihood of price swings. I personally use anything above 75 as overbought and anything under 25 as oversold. The RSI has established two upward trending levels of support. Currently the RSI just bounced off of one of these lines. The last three times this occurred since this RSI support trend began resulted in quick gains of 5.36%, 7.83%, and 9.60%. This is the first indicator this fund could turn bullish.
The true strength index (TSI) is currently 4.0070. The TSI determines overbought/oversold levels and/or current trend. I solely use this as an indicator of trend as overbought and oversold levels vary. The TSI is double smoothed in its calculation and is a great indicator of upward and downward movement. The TSI has also been trending up since the beginning of 2016. Although the current TSI level is not near this supporting trendline, the delay in the indicator could be the reason. It is important to note the TSI has come down from its most recent peak and its current position normally occurs as the fund is sliding downward. This indicator may be telling us the downward movement may continue for a little bit longer before the fund progresses upward.
The positive vortex indicator (VI) is at 0.6967 and the negative is at 1.1494. When the positive level is higher than 1 and higher than the negative indicator, the overall price action is moving upward. When the negative level is higher than 1 and higher than the positive indicator, the overall price action is moving downward. Even though both indicators are unfavorable to bullish movement, they have both begun to reverse course. This reversal does require more movement to favor new bullish movement for the fund. If this movement occurs within the next 3 days, the fund should begin moving upward.
The stochastic oscillator K value is 4.0425 and D value is 11.0491. This is a cyclical oscillator that is highly accurate and can be used to identify overbought/oversold levels as well as pending reversals and short-term activity. I personally use anything above 80 as overbought and below 20 as oversold. When the K value is higher than the D value, the stock is trending up. When the D value is higher that the K value the stock is trending down. This indicator is clearly in oversold territory. Previous oversold levels for this indicator during the fund's upward trend have always lead to a reversal. This is another strong indicator the fund will move upward.
Considering the RSI, TSI, VI and stochastic levels, the overall direction favors a move to the upside, although definitive upward movement may take a few more days to develop. Based on historical movement compared to current levels and the current position, the fund could gain at least 4% over the next 27 trading days if not sooner.

30 Delta Strangle on XRT I always look to have a trades on the most liquid ETF's and I just closed a Straddle on XRT so is time to redeploy with 45 days to expiration. IV rank is at 37. Sold the 40/43 Strangle on XRT for $1.02 per contract (30 Delta).
61% probability of profit
Credit = $1.02
My break evens are below 38.98 and above 44.02
Will look to close at 50% of the credit received.