XSW: 9 MONTH BREAKOUTXSW is breaking out of its 9 month horizontal trading range. Higher highs on noted on the RSI and an uptrend in the MACD.
Key stats
About SPDR S&P Software & Services ETF
Home page
Inception date
Sep 28, 2011
Structure
Open-Ended Fund
Replication method
Physical
Dividend treatment
Distributes
Distribution tax treatment
Qualified dividends
Income tax type
Capital Gains
Max ST capital gains rate
39.60%
Max LT capital gains rate
20.00%
Primary advisor
SSgA Funds Management, Inc.
Distributor
State Street Corp. (Fund Distributor)
XSW delivers a portfolio that targets the software and services segment of the US equity market. The software industry is extremely top-heavy and concentrated so ETFs providing exposure to the industry have to address these challenges. XSW does so by broadening its mandate to include services firms and equal-weighting its portfolio to reduce concentration in the top industry companies. Ultimately, the fund delivers on its mandate to invest in both software and services and emphasizes the latter. Its equal-weighting scheme produces tilts toward smaller, growth-oriented companies. The index is rebalanced quarterly.
Related funds
Classification
What's in the fund
Exposure type
Technology Services
Stock breakdown by region
Top 10 holdings

XSW ETF Long-Term Trading Opportunity 1expect XSW to increase in value to around $170+- Dollar in 6-24 month+-
I have set up an order to buy at $139 per ETF unit for a total of 70 units.
I have no fixed take profit as of now, but a trailing stop loss will be implemented
Stop Loss is around $120+- (will be adjusted accordingly, this is

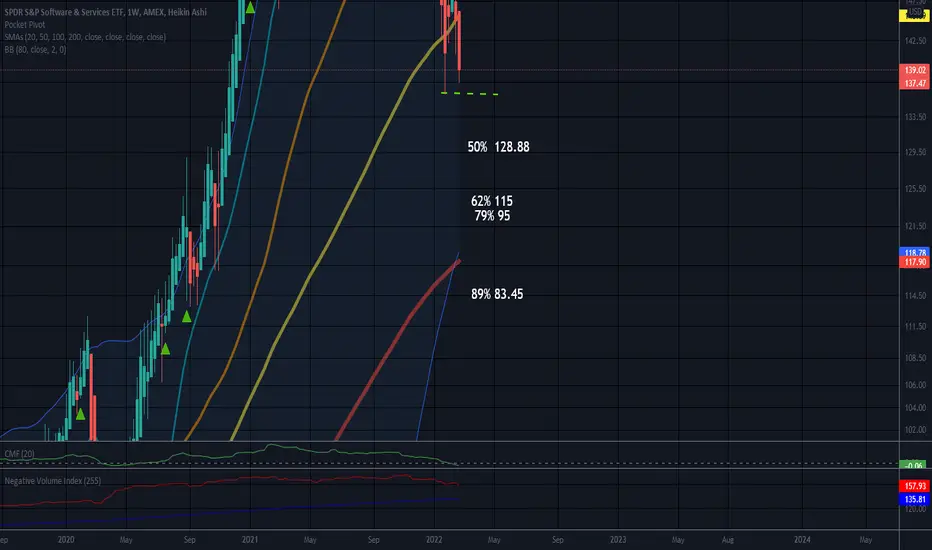
Possible Parabolic ArcETF but can still ARC
Most Arcs land between to 79% and 62% mark.
Some fall less, some fall more.
This is a weekly chart. ARCs are easier to see on monthly and weekly charts.
Too much green can cause a lot of red on the way down. Unfortunately, nothing goes up forever. A steep green rise is o
Cup and HandleI like trading ETFs and software seems like a winner to me! I am watching this closely. This particular ETF could have a nice reward too.
Target 1: 130 to 145
Target 2: 170 to 180
This one is pulling back right now and if I enter it I would have to play the stop by ear. There is a tiny gap that

Short Semiconductors ETF for next 6 monthHedge thrue software ETF, please consider Beta (both ETF) for this spread.

See all ideas
Summarizing what the indicators are suggesting.
Oscillators
Neutral
SellBuy
Strong sellStrong buy
Strong sellSellNeutralBuyStrong buy
Oscillators
Neutral
SellBuy
Strong sellStrong buy
Strong sellSellNeutralBuyStrong buy
Summary
Neutral
SellBuy
Strong sellStrong buy
Strong sellSellNeutralBuyStrong buy
Summary
Neutral
SellBuy
Strong sellStrong buy
Strong sellSellNeutralBuyStrong buy
Summary
Neutral
SellBuy
Strong sellStrong buy
Strong sellSellNeutralBuyStrong buy
Moving Averages
Neutral
SellBuy
Strong sellStrong buy
Strong sellSellNeutralBuyStrong buy
Moving Averages
Neutral
SellBuy
Strong sellStrong buy
Strong sellSellNeutralBuyStrong buy
Displays a symbol's price movements over previous years to identify recurring trends.
Frequently Asked Questions
An exchange-traded fund (ETF) is a collection of assets (stocks, bonds, commodities, etc.) that track an underlying index and can be bought on an exchange like individual stocks.
XSW trades at 178.93 USD today, its price has fallen −2.05% in the past 24 hours. Track more dynamics on XSW price chart.
XSW net asset value is 181.45 today — it's fallen 5.31% over the past month. NAV represents the total value of the fund's assets less liabilities and serves as a gauge of the fund's performance.
XSW assets under management is 476.58 M USD. AUM is an important metric as it reflects the fund's size and can serve as a gauge of how successful the fund is in attracting investors, which, in its turn, can influence decision-making.
XSW price has fallen by −6.78% over the last month, and its yearly performance shows a 22.37% increase. See more dynamics on XSW price chart.
NAV returns, another gauge of an ETF dynamics, have risen by −5.31% over the last month, have fallen by −5.31% over the last month, showed a 10.53% increase in three-month performance and has increased by 29.93% in a year.
NAV returns, another gauge of an ETF dynamics, have risen by −5.31% over the last month, have fallen by −5.31% over the last month, showed a 10.53% increase in three-month performance and has increased by 29.93% in a year.
XSW fund flows account for 64.43 M USD (1 year). Many traders use this metric to get insight into investors' sentiment and evaluate whether it's time to buy or sell the fund.
Since ETFs work like an individual stock, they can be bought and sold on exchanges (e.g. NASDAQ, NYSE, EURONEXT). As it happens with stocks, you need to select a brokerage to access trading. Explore our list of available brokers to find the one to help execute your strategies. Don't forget to do your research before getting to trading. Explore ETFs metrics in our ETF screener to find a reliable opportunity.
XSW invests in stocks. See more details in our Analysis section.
XSW expense ratio is 0.35%. It's an important metric for helping traders understand the fund's operating costs relative to assets and how expensive it would be to hold the fund.
No, XSW isn't leveraged, meaning it doesn't use borrowings or financial derivatives to magnify the performance of the underlying assets or index it follows.
In some ways, ETFs are safe investments, but in a broader sense, they're not safer than any other asset, so it's crucial to analyze a fund before investing. But if your research gives a vague answer, you can always refer to technical analysis.
Today, XSW technical analysis shows the sell rating and its 1-week rating is buy. Since market conditions are prone to changes, it's worth looking a bit further into the future — according to the 1-month rating XSW shows the buy signal. See more of XSW technicals for a more comprehensive analysis.
Today, XSW technical analysis shows the sell rating and its 1-week rating is buy. Since market conditions are prone to changes, it's worth looking a bit further into the future — according to the 1-month rating XSW shows the buy signal. See more of XSW technicals for a more comprehensive analysis.
Yes, XSW pays dividends to its holders with the dividend yield of 0.06%.
XSW trades at a premium (0.04%).
Premium/discount to NAV expresses the difference between the ETF’s price and its NAV value. A positive percentage indicates a premium, meaning the ETF trades at a higher price than the calculated NAV. Conversely, a negative percentage indicates a discount, suggesting the ETF trades at a lower price than NAV.
Premium/discount to NAV expresses the difference between the ETF’s price and its NAV value. A positive percentage indicates a premium, meaning the ETF trades at a higher price than the calculated NAV. Conversely, a negative percentage indicates a discount, suggesting the ETF trades at a lower price than NAV.
XSW shares are issued by State Street Corp.
XSW follows the S&P Software & Services Select Industry. ETFs usually track some benchmark seeking to replicate its performance and guide asset selection and objectives.
The fund started trading on Sep 28, 2011.
The fund's management style is passive, meaning it's aiming to replicate the performance of the underlying index by holding assets in the same proportions as the index. The goal is to match the index's returns.