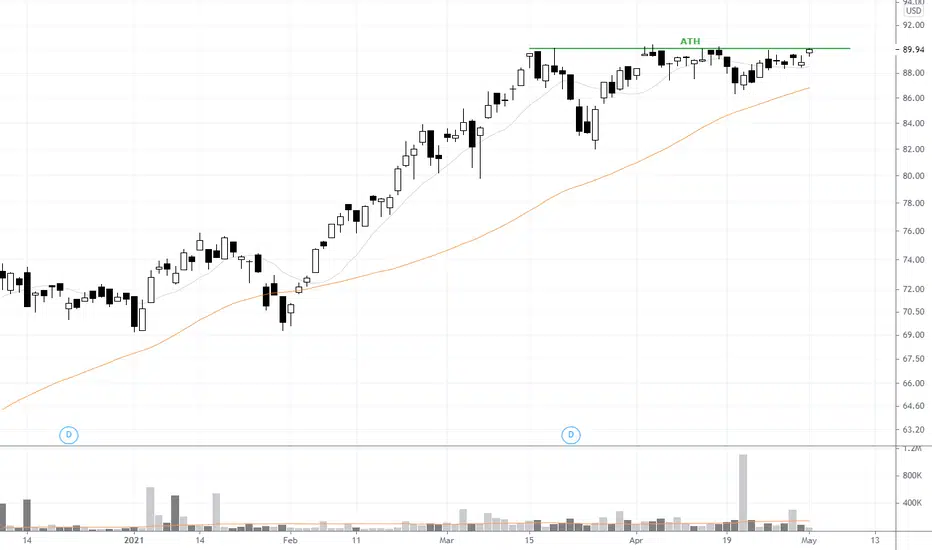
XTN Long-term BuysI am looking for buys on XTN. We have come into the monthly 50% retracement level and have also created a Wyckoff Schematic. This is a great long-term buy opportunity
Key stats
About SPDR S&P Transportation ETF
Home page
Inception date
Jan 26, 2011
Structure
Open-Ended Fund
Replication method
Physical
Dividend treatment
Distributes
Distribution tax treatment
Qualified dividends
Income tax type
Capital Gains
Max ST capital gains rate
39.60%
Max LT capital gains rate
20.00%
Primary advisor
SSgA Funds Management, Inc.
Distributor
State Street Corp. (Fund Distributor)
XTN offers a straightforward work-around for the transportation industry's high concentration by equal-weighting its holdings. That drastically cuts its weighted average market cap and introduces some sector biases. Eligible securities must be included in the S&P Total Market Index and must meet certain liquidity and capitalization thresholds. The Underlying Index includes the following sub-industries, as defined by GICS: air freight & logistics, airlines, airport services, highways & rail tracks, marine, marine ports & services, railroads, and trucking. The index undergoes quarterly rebalance.
Related funds
Classification
What's in the fund
Exposure type
Transportation
Stock breakdown by region
Top 10 holdings

SPX. Transportation sector's RSI is deep into correction lvls !!XTN/SPX is way into correction territory. This market is just different !!!
Believe it or not, It's like saying we just finished 1/2 a correction @ the last dip !!!

Houston we have a problem- Chart speaks for itselfHouston we have a problem- Chart speaks for itself
That's a ugly weekly candle, absolutely no hesitation at the 1.618. You know what they say about transports. This could be start of Waterfall crash. You could most likely short the market until this thing gets above the trendline Stop Loss the


See all ideas
Summarizing what the indicators are suggesting.
Oscillators
Neutral
SellBuy
Strong sellStrong buy
Strong sellSellNeutralBuyStrong buy
Oscillators
Neutral
SellBuy
Strong sellStrong buy
Strong sellSellNeutralBuyStrong buy
Summary
Neutral
SellBuy
Strong sellStrong buy
Strong sellSellNeutralBuyStrong buy
Summary
Neutral
SellBuy
Strong sellStrong buy
Strong sellSellNeutralBuyStrong buy
Summary
Neutral
SellBuy
Strong sellStrong buy
Strong sellSellNeutralBuyStrong buy
Moving Averages
Neutral
SellBuy
Strong sellStrong buy
Strong sellSellNeutralBuyStrong buy
Moving Averages
Neutral
SellBuy
Strong sellStrong buy
Strong sellSellNeutralBuyStrong buy
Displays a symbol's price movements over previous years to identify recurring trends.
Frequently Asked Questions
An exchange-traded fund (ETF) is a collection of assets (stocks, bonds, commodities, etc.) that track an underlying index and can be bought on an exchange like individual stocks.
XTN trades at 80.97 USD today, its price has fallen −1.20% in the past 24 hours. Track more dynamics on XTN price chart.
XTN net asset value is 81.01 today — it's fallen 3.68% over the past month. NAV represents the total value of the fund's assets less liabilities and serves as a gauge of the fund's performance.
XTN assets under management is 144.82 M USD. AUM is an important metric as it reflects the fund's size and can serve as a gauge of how successful the fund is in attracting investors, which, in its turn, can influence decision-making.
XTN price has fallen by −3.34% over the last month, and its yearly performance shows a 8.18% increase. See more dynamics on XTN price chart.
NAV returns, another gauge of an ETF dynamics, have risen by −3.68% over the last month, have fallen by −3.68% over the last month, showed a 9.89% increase in three-month performance and has increased by 10.45% in a year.
NAV returns, another gauge of an ETF dynamics, have risen by −3.68% over the last month, have fallen by −3.68% over the last month, showed a 9.89% increase in three-month performance and has increased by 10.45% in a year.
XTN fund flows account for −77.11 M USD (1 year). Many traders use this metric to get insight into investors' sentiment and evaluate whether it's time to buy or sell the fund.
Since ETFs work like an individual stock, they can be bought and sold on exchanges (e.g. NASDAQ, NYSE, EURONEXT). As it happens with stocks, you need to select a brokerage to access trading. Explore our list of available brokers to find the one to help execute your strategies. Don't forget to do your research before getting to trading. Explore ETFs metrics in our ETF screener to find a reliable opportunity.
XTN invests in stocks. See more details in our Analysis section.
XTN expense ratio is 0.35%. It's an important metric for helping traders understand the fund's operating costs relative to assets and how expensive it would be to hold the fund.
No, XTN isn't leveraged, meaning it doesn't use borrowings or financial derivatives to magnify the performance of the underlying assets or index it follows.
In some ways, ETFs are safe investments, but in a broader sense, they're not safer than any other asset, so it's crucial to analyze a fund before investing. But if your research gives a vague answer, you can always refer to technical analysis.
Today, XTN technical analysis shows the sell rating and its 1-week rating is buy. Since market conditions are prone to changes, it's worth looking a bit further into the future — according to the 1-month rating XTN shows the buy signal. See more of XTN technicals for a more comprehensive analysis.
Today, XTN technical analysis shows the sell rating and its 1-week rating is buy. Since market conditions are prone to changes, it's worth looking a bit further into the future — according to the 1-month rating XTN shows the buy signal. See more of XTN technicals for a more comprehensive analysis.
Yes, XTN pays dividends to its holders with the dividend yield of 0.93%.
XTN trades at a premium (0.05%).
Premium/discount to NAV expresses the difference between the ETF’s price and its NAV value. A positive percentage indicates a premium, meaning the ETF trades at a higher price than the calculated NAV. Conversely, a negative percentage indicates a discount, suggesting the ETF trades at a lower price than NAV.
Premium/discount to NAV expresses the difference between the ETF’s price and its NAV value. A positive percentage indicates a premium, meaning the ETF trades at a higher price than the calculated NAV. Conversely, a negative percentage indicates a discount, suggesting the ETF trades at a lower price than NAV.
XTN shares are issued by State Street Corp.
XTN follows the S&P Transportation Select Industry. ETFs usually track some benchmark seeking to replicate its performance and guide asset selection and objectives.
The fund started trading on Jan 26, 2011.
The fund's management style is passive, meaning it's aiming to replicate the performance of the underlying index by holding assets in the same proportions as the index. The goal is to match the index's returns.