YCS pro shares ultrashort yenHi Trader. Keep watching this space. 65.71 seems to be the place to buy.
Key stats
About ProShares UltraShort Yen New
Home page
Inception date
Nov 25, 2008
Structure
Commodities Pool
Replication method
Synthetic
Dividend treatment
Distributes
Distribution tax treatment
No distributions
Income tax type
60/40
Max ST capital gains rate
27.84%
Max LT capital gains rate
27.84%
Primary advisor
ProShare Advisors LLC
Distributor
SEI Investments Distribution Co.
YCS offers 2x leveraged inverse exposure to the Japanese yen/US dollar cross, providing big gains when the yen falls against the dollar. The fund is designed to be a short-term product, and rebalances its -2x exposure on a daily basis. As a result, long-term returns in YCL could diverge significantly from expected returns due to compounding effect and path dependency. Also, keep in mind that the fund's NAV is calculated according to the JPY/USD cross as published in the Wall Street Journal a value that may differ from other quoting sources.
Related funds
Classification
Symbol
Geography
Japan
What's in the fund
Exposure type
Cash
Bonds, Cash & Other100.00%
Cash100.00%
Top 10 holdings


$YCS achieves measured move target on weekly chart $USDJPYToday's close hit the second and higher measured move that I laid out for YCS. Two months ago I posted this chart:
Direct bulls-eye. The question is what comes next?
One possible scenario: I could see price bounce between 82.50 and 78.50 to digest gains and then try for higher levels after a per

$YCS breaking out . Can 2009 highs be surpassed? $USDJPY Measured moves shown on chart. If 71 holds then 78.50 and 82.50 are next upside targets

possible PT's for $USDJPYIf this pattern plays out then 55 and 50 could be possible PTs. Is this good for $SPY ?


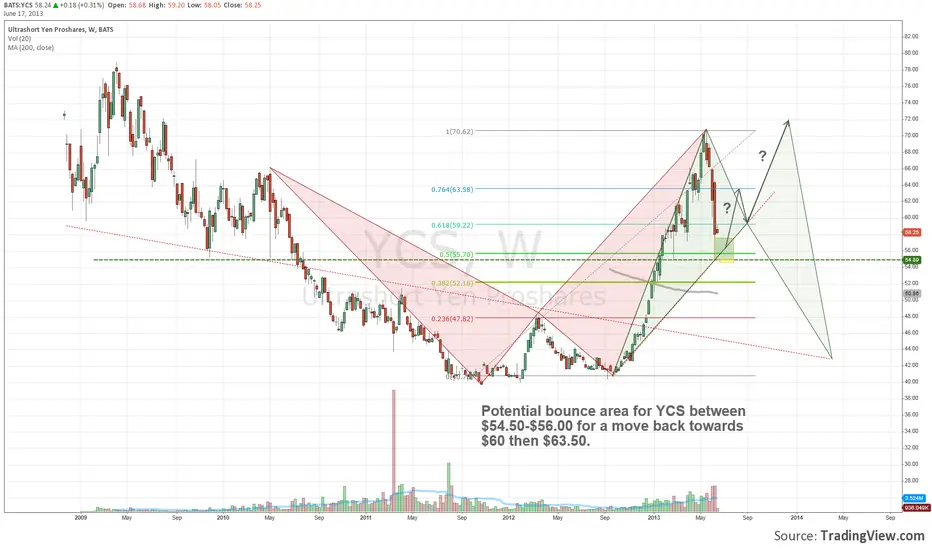
Looking for a YCS bounce?Potential bounce area btw $54-56 for a move back to $60 then $63. $USDJPY $DXJ $SPX $SPY $STUDY
See all ideas
Summarizing what the indicators are suggesting.
Oscillators
Neutral
SellBuy
Strong sellStrong buy
Strong sellSellNeutralBuyStrong buy
Oscillators
Neutral
SellBuy
Strong sellStrong buy
Strong sellSellNeutralBuyStrong buy
Summary
Neutral
SellBuy
Strong sellStrong buy
Strong sellSellNeutralBuyStrong buy
Summary
Neutral
SellBuy
Strong sellStrong buy
Strong sellSellNeutralBuyStrong buy
Summary
Neutral
SellBuy
Strong sellStrong buy
Strong sellSellNeutralBuyStrong buy
Moving Averages
Neutral
SellBuy
Strong sellStrong buy
Strong sellSellNeutralBuyStrong buy
Moving Averages
Neutral
SellBuy
Strong sellStrong buy
Strong sellSellNeutralBuyStrong buy
Displays a symbol's price movements over previous years to identify recurring trends.
Frequently Asked Questions
An exchange-traded fund (ETF) is a collection of assets (stocks, bonds, commodities, etc.) that track an underlying index and can be bought on an exchange like individual stocks.
YCS trades at 43.67 USD today, its price has fallen −4.50% in the past 24 hours. Track more dynamics on YCS price chart.
YCS net asset value is 43.59 today — it's risen 5.78% over the past month. NAV represents the total value of the fund's assets less liabilities and serves as a gauge of the fund's performance.
YCS assets under management is 27.27 M USD. AUM is an important metric as it reflects the fund's size and can serve as a gauge of how successful the fund is in attracting investors, which, in its turn, can influence decision-making.
YCS price has risen by 5.48% over the last month, and its yearly performance shows a 3.95% increase. See more dynamics on YCS price chart.
NAV returns, another gauge of an ETF dynamics, have risen by 5.78% over the last month, showed a 5.09% increase in three-month performance and has increased by 4.71% in a year.
NAV returns, another gauge of an ETF dynamics, have risen by 5.78% over the last month, showed a 5.09% increase in three-month performance and has increased by 4.71% in a year.
YCS fund flows account for −12.86 M USD (1 year). Many traders use this metric to get insight into investors' sentiment and evaluate whether it's time to buy or sell the fund.
Since ETFs work like an individual stock, they can be bought and sold on exchanges (e.g. NASDAQ, NYSE, EURONEXT). As it happens with stocks, you need to select a brokerage to access trading. Explore our list of available brokers to find the one to help execute your strategies. Don't forget to do your research before getting to trading. Explore ETFs metrics in our ETF screener to find a reliable opportunity.
YCS invests in cash. See more details in our Analysis section.
YCS expense ratio is 0.95%. It's an important metric for helping traders understand the fund's operating costs relative to assets and how expensive it would be to hold the fund.
Yes, YCS is a leveraged ETF, meaning it uses borrowings or financial derivatives to magnify the performance of the underlying assets or index it follows.
In some ways, ETFs are safe investments, but in a broader sense, they're not safer than any other asset, so it's crucial to analyze a fund before investing. But if your research gives a vague answer, you can always refer to technical analysis.
Today, YCS technical analysis shows the neutral rating and its 1-week rating is buy. Since market conditions are prone to changes, it's worth looking a bit further into the future — according to the 1-month rating YCS shows the buy signal. See more of YCS technicals for a more comprehensive analysis.
Today, YCS technical analysis shows the neutral rating and its 1-week rating is buy. Since market conditions are prone to changes, it's worth looking a bit further into the future — according to the 1-month rating YCS shows the buy signal. See more of YCS technicals for a more comprehensive analysis.
No, YCS doesn't pay dividends to its holders.
YCS trades at a premium (0.18%).
Premium/discount to NAV expresses the difference between the ETF’s price and its NAV value. A positive percentage indicates a premium, meaning the ETF trades at a higher price than the calculated NAV. Conversely, a negative percentage indicates a discount, suggesting the ETF trades at a lower price than NAV.
Premium/discount to NAV expresses the difference between the ETF’s price and its NAV value. A positive percentage indicates a premium, meaning the ETF trades at a higher price than the calculated NAV. Conversely, a negative percentage indicates a discount, suggesting the ETF trades at a lower price than NAV.
YCS shares are issued by ProShare Advisors LLC
YCS follows the Japanese Yen per U.S. Dollar. ETFs usually track some benchmark seeking to replicate its performance and guide asset selection and objectives.
The fund started trading on Nov 25, 2008.
The fund's management style is passive, meaning it's aiming to replicate the performance of the underlying index by holding assets in the same proportions as the index. The goal is to match the index's returns.