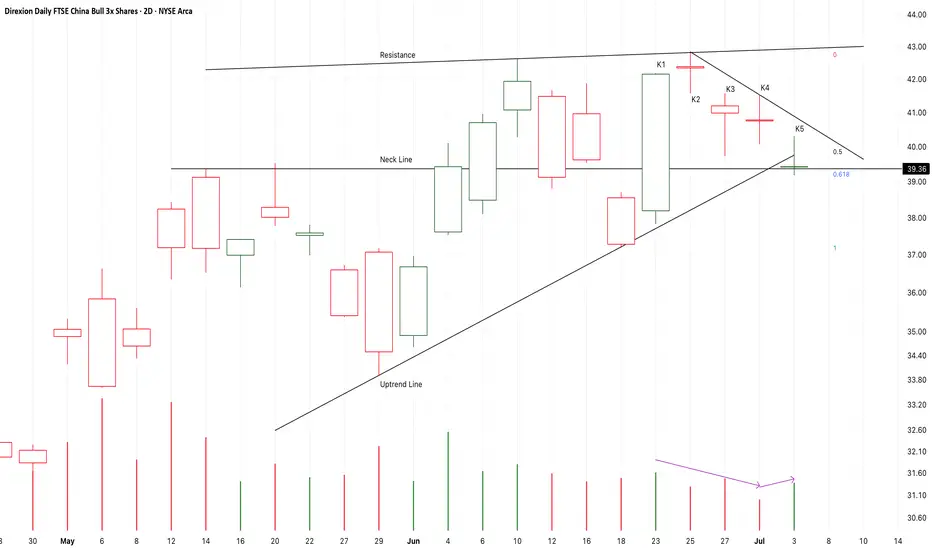
Chart Pattern Analysis Of YINN
From K1 to K5,
It is a small scale consolidation or a bullish triangle pattern.
The supply pressure is decreasing too.
It seems that K6 or K7 will break up or fall down.
If the following candles close upon K3 or K4,
It is likely that another bull run will start here to test 77USD area.
On the oth
Key stats
About Direxion Daily FTSE China Bull 3x Shares
Home page
Inception date
Dec 3, 2009
Structure
Open-Ended Fund
Replication method
Synthetic
Dividend treatment
Distributes
Distribution tax treatment
Ordinary income
Income tax type
Capital Gains
Max ST capital gains rate
39.60%
Max LT capital gains rate
20.00%
Primary advisor
Rafferty Asset Management LLC
Distributor
Foreside Fund Services LLC
YINN is an aggressive daily bet on Chinese large-cap equities, delivering 3x leveraged exposure to about 50 large and liquid names traded in Hong Kong. The fund's underlying equity exposure doesn't aim for comprehensive all China exposure since it excludes A-shares traded on the mainland and names listed solely in the US. Given the underlying index, big sector bets can be expected. The fund rebalances its leveraged exposure daily, so over the long haul, compounding effects can lead to profound differences in expected returns relative to the index. Thus, it is not a buy-and-hold investment and should not be expected to provide index leverage returns greater than a one-day period. The index is rebalanced quarterly.
Related funds
Classification
What's in the fund
Exposure type
ETF
Cash
Stock breakdown by region
Top 10 holdings
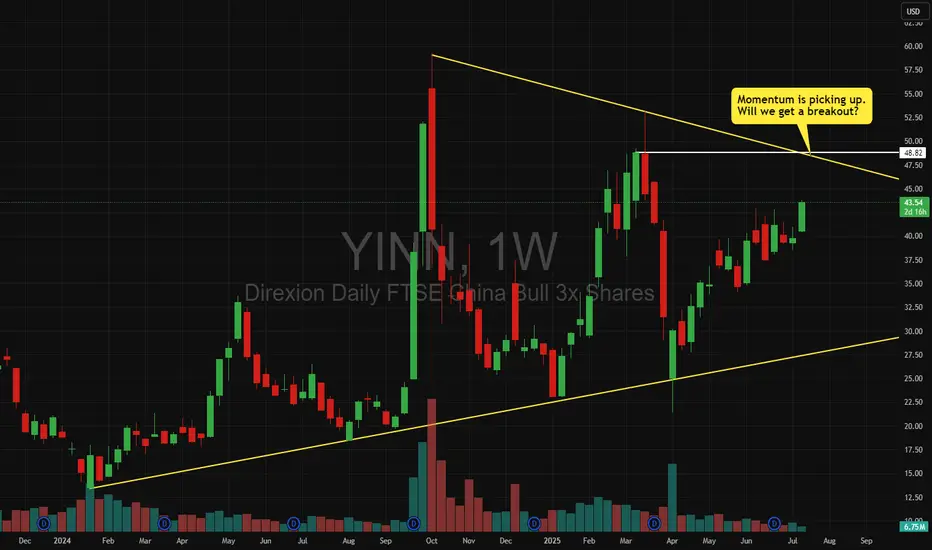
YINN - We could get a bullish breakout of the triangleMomentum seems to be picking up.
Will we a break out of the triangle?
Let's watch the $48 level.
YINN Stock Chart Fibonacci Analysis 042525Trading Idea
1) Find a FIBO slingshot
2) Check FIBO 61.80% level
3) Entry Point > 30/61.80%
Chart time frame: D
A) 15 min(1W-3M)
B) 1 hr(3M-6M)
C) 4 hr(6M-1year)
D) 1 day(1-3years)
Stock progress: A
A) Keep rising over 61.80% resistance
B) 61.80% resistance
C) 61.80% support
D) Hit the bottom
E

YINN Massive drop, hold! Today’s drop on AMEX:YINN was brutal — no sugarcoating it. But in every downturn lies opportunity. This isn’t the first time we’ve seen this kind of volatility, and it won’t be the last.
Why I’m holding:
Long-term China exposure still holds strategic value.
🌱 Patience = Power
If you believed in

YINN Stock Chart Fibonacci Analysis 040525Trading Idea
1) Find a FIBO slingshot
2) Check FIBO 61.80% level
3) Entry Point > 30/61.80%
Chart time frame: B
A) 15 min(1W-3M)
B) 1 hr(3M-6M)
C) 4 hr(6M-1year)
D) 1 day(1-3years)
Stock progress: C
A) Keep rising over 61.80% resistance
B) 61.80% resistance
C) 61.80% support
D) Hit the bottom
E


YINN to the Moon? Here’s Why We’re Bullish!💥 YINN is setting up for what looks like a textbook breakout moment, and we’re here for it! 📈 With a combination of strong market momentum, improving sentiment in the Chinese economy, and a solid technical setup, this triple-leveraged China ETF is catching fire.
🔥 Why YINN is a Strong Play:
1️⃣ Ch

SOY 2024 - YINN (China) Monthly Seasonality StatsThe chart for YINN (Direxion Daily FTSE China Bull 3X Shares) reveals notable seasonal trends and volatility from 2015 to 2024. Historically, the YINN ETF shows strong performance in the first quarter, particularly in January and February, with gains in 2017, 2020, and 2021. However, the ETF fac

SIZZLING-YINN-HANDLE!!!! There's been a global paradigm shift As Biden's re-election prospects diminish and recent events are raising concerns. While US and Europe valuations are within fair value range based on forward P/E ratios the tremendous laggard China has turned its corner in cracking the chip after Pres Xi spent ab

Trading YINN? Two sides of a COINFrom China "uninvestable" to social media influencers calling bulls in the HK/China market and there are some followers getting edgy what they should do.
I know what I will do since I am clear with my objectives , time horizon, risk tolerance, capital management, etc.
For my existing holdings, I

See all ideas
Summarizing what the indicators are suggesting.
Oscillators
Neutral
SellBuy
Strong sellStrong buy
Strong sellSellNeutralBuyStrong buy
Oscillators
Neutral
SellBuy
Strong sellStrong buy
Strong sellSellNeutralBuyStrong buy
Summary
Neutral
SellBuy
Strong sellStrong buy
Strong sellSellNeutralBuyStrong buy
Summary
Neutral
SellBuy
Strong sellStrong buy
Strong sellSellNeutralBuyStrong buy
Summary
Neutral
SellBuy
Strong sellStrong buy
Strong sellSellNeutralBuyStrong buy
Moving Averages
Neutral
SellBuy
Strong sellStrong buy
Strong sellSellNeutralBuyStrong buy
Moving Averages
Neutral
SellBuy
Strong sellStrong buy
Strong sellSellNeutralBuyStrong buy
Displays a symbol's price movements over previous years to identify recurring trends.
Frequently Asked Questions
An exchange-traded fund (ETF) is a collection of assets (stocks, bonds, commodities, etc.) that track an underlying index and can be bought on an exchange like individual stocks.
YINN trades at 40.54 USD today, its price has fallen −4.77% in the past 24 hours. Track more dynamics on YINN price chart.
YINN net asset value is 40.46 today — it's fallen 1.72% over the past month. NAV represents the total value of the fund's assets less liabilities and serves as a gauge of the fund's performance.
YINN assets under management is 1.11 B USD. AUM is an important metric as it reflects the fund's size and can serve as a gauge of how successful the fund is in attracting investors, which, in its turn, can influence decision-making.
YINN price has risen by 0.12% over the last month, and its yearly performance shows a 91.86% increase. See more dynamics on YINN price chart.
NAV returns, another gauge of an ETF dynamics, have risen by −1.72% over the last month, have fallen by −1.72% over the last month, showed a 15.65% increase in three-month performance and has increased by 95.15% in a year.
NAV returns, another gauge of an ETF dynamics, have risen by −1.72% over the last month, have fallen by −1.72% over the last month, showed a 15.65% increase in three-month performance and has increased by 95.15% in a year.
YINN fund flows account for −109.46 M USD (1 year). Many traders use this metric to get insight into investors' sentiment and evaluate whether it's time to buy or sell the fund.
Since ETFs work like an individual stock, they can be bought and sold on exchanges (e.g. NASDAQ, NYSE, EURONEXT). As it happens with stocks, you need to select a brokerage to access trading. Explore our list of available brokers to find the one to help execute your strategies. Don't forget to do your research before getting to trading. Explore ETFs metrics in our ETF screener to find a reliable opportunity.
YINN invests in funds. See more details in our Analysis section.
YINN expense ratio is 1.36%. It's an important metric for helping traders understand the fund's operating costs relative to assets and how expensive it would be to hold the fund.
Yes, YINN is a leveraged ETF, meaning it uses borrowings or financial derivatives to magnify the performance of the underlying assets or index it follows.
In some ways, ETFs are safe investments, but in a broader sense, they're not safer than any other asset, so it's crucial to analyze a fund before investing. But if your research gives a vague answer, you can always refer to technical analysis.
Today, YINN technical analysis shows the sell rating and its 1-week rating is buy. Since market conditions are prone to changes, it's worth looking a bit further into the future — according to the 1-month rating YINN shows the neutral signal. See more of YINN technicals for a more comprehensive analysis.
Today, YINN technical analysis shows the sell rating and its 1-week rating is buy. Since market conditions are prone to changes, it's worth looking a bit further into the future — according to the 1-month rating YINN shows the neutral signal. See more of YINN technicals for a more comprehensive analysis.
Yes, YINN pays dividends to its holders with the dividend yield of 1.66%.
YINN trades at a premium (0.19%).
Premium/discount to NAV expresses the difference between the ETF’s price and its NAV value. A positive percentage indicates a premium, meaning the ETF trades at a higher price than the calculated NAV. Conversely, a negative percentage indicates a discount, suggesting the ETF trades at a lower price than NAV.
Premium/discount to NAV expresses the difference between the ETF’s price and its NAV value. A positive percentage indicates a premium, meaning the ETF trades at a higher price than the calculated NAV. Conversely, a negative percentage indicates a discount, suggesting the ETF trades at a lower price than NAV.
YINN shares are issued by Rafferty Asset Management LLC
YINN follows the FTSE China 50 Net Tax USD Index. ETFs usually track some benchmark seeking to replicate its performance and guide asset selection and objectives.
The fund started trading on Dec 3, 2009.
The fund's management style is passive, meaning it's aiming to replicate the performance of the underlying index by holding assets in the same proportions as the index. The goal is to match the index's returns.