YINN | Chinese 3X Bull ETF | LONGThe fund invests at least 80% of its total assets in equity securities of the index and in depositary receipts representing such securities. The index is designed to measure the equity market performance of investable publicly traded "China-based companies" whose primary business or businesses are in the Internet and Internet-related sectors, and are listed outside of Mainland China, as determined by the index provider. The fund is non-diversified.
YINN trade ideas

NihaoNihao my friends, this will be huge, from a stalled economy to a reopening, we will see this rise like 1000% in the next moths

I am a YINN believer now!i am sure, this baby is going to grow more than 200% in a few months, China is reopening officially and all the numbers should be much better than a year ago when nothing was open

YINN China 3X Leverage ETF Reverses off the bottom Swing Long
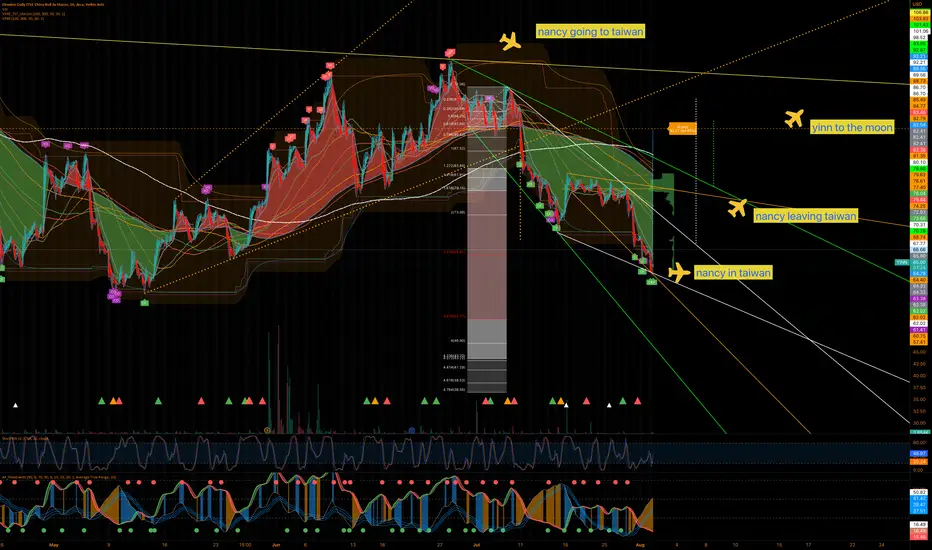
AMEX:YINN YINN is now in an uptrend with an increasing cloud score
and upgoing BB boundaries. Stop Loss at the double bottom
while the first target is the recent consolidation period
with about 15% upside to that take profit and about a
2.5 Reward to Risk
All this makes YINN a candidate for a swing long trade

YINN China Bear #X Leverage ETFAMEX:YINN
China has had lockdowns, trade wars, delisting and
so on yet it hangs in there,
The YINN ETF downtrend is in early reversal.
An entry point may be soon RSI provides
confirmation.

looking the balance with Yinn after a yang yearThis ETF, is starting a bull trend, you just have tu buy and wait for more than 100%

is time for the balance of the forces yin yangi have been tracking this activity and now switching to $YINN, something good is coming guys.

at least 30% with this ETFChina stuff is cheap today with all the rumors, but the true is that alibaba is the king of the ecommerce, so you will se a nice rebound in this ETF

chineses reopening MacauWell. if you are following the news, China is reopening, the demand of microchips has been like in 2018 and more, Macau is reopening and Alibaba is selling like crazy. Technically you can find a huge symmetrical triangle like in bitcoin and other stocks, that could take it at least 40% from here.

Flag and folksMorning, today we have a flag like 5% for today, and there are like 4 patterns pointing to over 102 price.

YINN LongTechnical analysis on the YINN, it is a Chinese bullish 3X leveraged ETF with the largest holdings including Tencent and Alibaba. I am a huge fan of Chinese tech stocks, the Chinese market is massive and constantly growing as Chinese regulations becomes more lose (which if they want to compete with the United States it will) then Chinese stocks will start reaching their appropriate stock prices. My estimate in the Yinn hits 9 a share by mid May.

YINN, my second all in bet with a stopThis thing has been falling for 4 weeks non stop. Its quite standard for market crashes to last this long (see covid, and a bunch of other dow crashes in the early century) and the stock has started to go up. Could be wrong, but thats what stops are for.

CHINA: It’s time to shine {DIAMOND REVERSAL) Next 3 movesAfter falling 77% from ATH to a level lower than Mar2020, I think YINN is ready to reverse.
What is forming maybe a head & shoulder pattern inside a diamond pattern.
Measured TP of H&S is 18. I think it will go to 16 first, then retrace to 13 before going to the TP at 18.
Many Chinese stocks are already making HLHH like BIDU, JD, NIO, VIPS, LI.
These Chinese indices are also making sort of Diamond or H&S patterns like MCHI,GXC & KWEB.
Major indices have also made a HLHH like SPY, SMH,XLK, XLY, XLV, ACWI, EEM, EPP, EWJ, EWA,VNM, THD & IEV.
It seems market sentiment is turning bullish & back to risk-on in time for a VALENTINE RALLY.
Not trading advice.

A potentially 80% return bets on China concept stocksLogarithmic regression is used to model data where growth or decay accelerates rapidly at first and then slows over time. This model is for the long term series data (such as 10 years time span).
The user can consider entering the market when the price below 25% or 5% confidence and consider take profit when the price goes above 75% or 95% confidence line.
currently China stocks swing around the base level in 10 years. meanwhile the US stock is still bullsih, reflecting there might be a fund rotation to those weaker countries
Fib levles already reach zero, so it might be attractive to bet on some rebounce. Target level could be Fib level: 0.382 = $17, which is a >100% return bet, meanwhile the stoploss is set on around $7.5.
Indicator (setting: stdev: 2.7,-2.7):

Buy $YINN - NRPicks 24 SepThe instrument seeks to return 300% of the daily performance of the FTSE China 50 index. The fund provides daily leveraged exposure to the index. The index consists of the 50 largest and most liquid public Chinese companies currently listed on the Hong Kong Stock Exchange.

TA'ing leveraged productsLeveraged products often "reset" overnight, and essentially track the underlying assets movement during market hours only. So if an underlying security pops 10% between close and open, the leveraged product gets priced that morning, against the open of the underlying asset. In theory, that movement wouldn't be captured by the leveraged product. At least that's how I understand it - for non-24x7 markets.
Note to self: don't fall into this trap again.
Also me: L@@K at that Monthly TD9!

bought Oct. 1 call vertical Looks like the market find the short term bottom, IMO. Bought Oct. 1st $9.5/$10.5 call vertical for $0.67. All I need is $YINN close above $10.5 by Friday expiration to realize $0.33 profit, about 50%.
My break even is $10.17.

YINN PlanBuy below $13. Sell above $19.50 for 1.5x gain. 2nd profit target 2x. 3rd profit target 3x.


YINN - is it going up or Down. Invs. SHS ?Is this a turning point. Invers SHS maybe.
Break above neckline and we have some good insight. IF that, strong upside.


