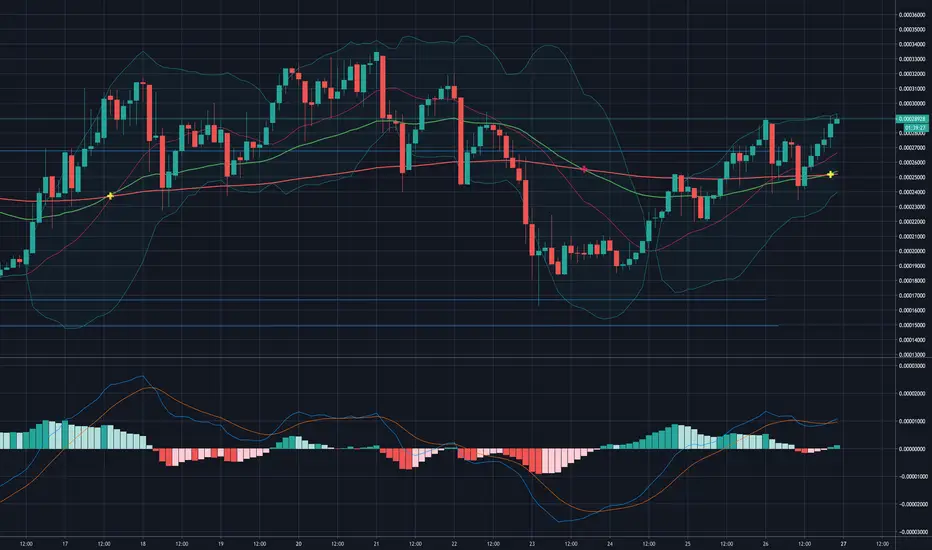
AMPLBTC. Is the bottom in? Falling Wedge..AMPLBTC1H. Developed a falling wedge to what may be the bottom? Difficult to really determine as it's a new coin. I've added a bit to my portfolio here.
AMPLBTC trade ideas


AMPLBTC The Decentralized FED - Tear of 50% Expected!Welcome to this quick update
AMPL Looks very very bullish here:
Why?
Fundamentals-
Potential Coinbase candidate
Finding dynamic support above the trend line. Breakout confirmed. Now in Accumulation!!!
Be ready to refuel now before blast off!
After a Tear run of 5000% in a month, it is good to see corrections and AMPL has done that.
AMPL now again refueling for the second run and now since it is in the peak of discussion in Crypto community and gaining attention of everyone,
Coinbase listing of this potential candidate makes it now even more lucrative.
Also TA wise we can see in lower timeframe Bullish MACD crossover and Bull mode on also Stoch RSI going way above indicating Bullish as well.
ENTRY: CMP (Current Market Price)
TARGETS:
9081
11695
24575
28874
If you like these setups,join our TG channel and please hit the like button and share your views in the comment section.
Stay safe
#PEACE


AMPL looks absolutely NUKEDWhat is going on with AMPL? So much bullish sentiment and yet we have lost over 86% to BTC and 84% to USD.
Is bad news to follow? I'm staying out until I see it find support and signs of life.


LITTLE MORE PUMP LEFT IN AMPL (CHECK OUT CHART)I would say another 5% to 8% left until it either rejects or goes on another tear. Will keep you posted!!!
Sorry for late publish!
Aru
of
Patriot Crypto


AMPL-BTC AMPL - DeFi project on Kucoin looks really hot. Bull pennant, 1d macd and stoch bullish.
Really good volume since the begining of July.
Got some at 2399, targets on chart.

AmpleForth, easy re-test of the previous high ?This coin is amazing , how is structured to calculate its price, and also how much potential it has for giving so much value to the users !
We might expect a double bottom, reaching and forming a the neckline ,consolidating on the current resistance,afterwards
Target on the chart!

AMPL:BTC long opportunity at 78.6% Fib retracement level.@ 78.6% Fib retracement (~0.000179 BTC)
Green IchiCloud forming.
Higher low set.
Inverse head and shoulder formation emerging again (clearer on the 5min chart).
Have the sell pressure ended?
Buy on confirmation: When AMPL goes above green 50 SMA and holds.
---
PRISM Oscillators Set (Momentum/Acceleration Analysis)
pRSI STOCHS in an oversold state (green background)
pRSI entering Bullish phase again, piercing above its 30 VWMA; supported by hidden bullish divergence.
Snap-Osc (yellow) in the positive, pulling AJ-ribbon upwell into the positive, which in turn have pulled the momentum oscillator up back into the positive again.
Looking at the hourly chart:
Looking at the 3 hourly chart:

AMPLBTCBreaking out. Showing good strength.
Would love to see it hit the 15500 range in the next day or two to show some strength.
