AMPUST trade ideas

AMPLIn the daily time, it is in a strong support zone. In my opinion, it is more suitable to buy the green box until it breaks the above lines.
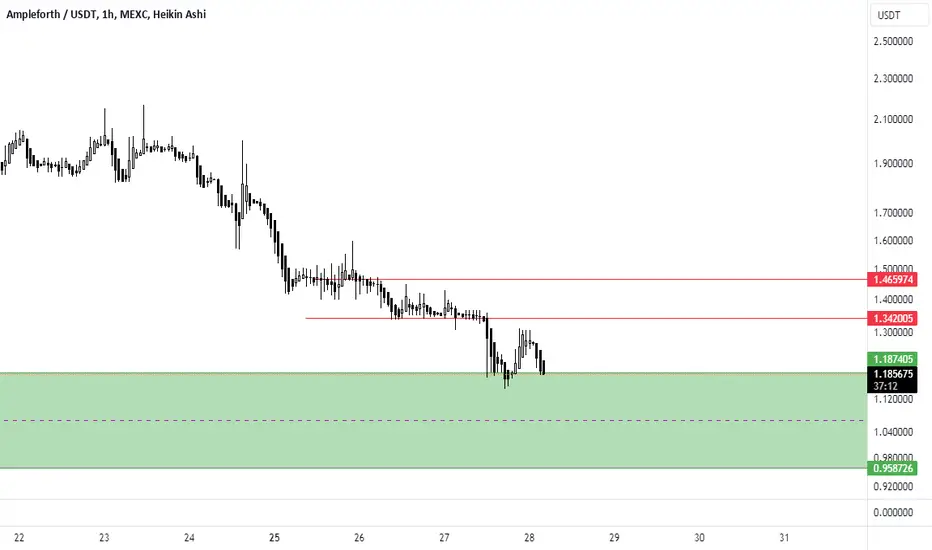
AMPL SHORTPotential short opportunity on AMPL, basic support and resistance at 1.2 so I will get in just before.

AMPLEFORTH really fascinating Giant TriangleThis is the biggest formation I think I've ever seen... Over the course of what, 700 days? Look at all the support and resistance levels coming together to form this beautiful almost musical like pattern.
This is the thing I love about technical analysis. Looking at a chart without any bias or Preconceived notions that I was taught by some crackpot that was selling me a bullshit course to learn from.
Look at every chart like a child with wonderment and an imagination with limitless possibilites. Don't lets yourself get pinned down inside a box that tells you that you have to do it this way, or that way it has to be exactly like X or Y, and if you don't abide by those rules, you won't get anywhere. I don't buy into that. I'm of the belief that there is so much unknown yet to learn.
Not everything is known
So without telling you what I think is going to happen here, I want you to take a look and tell me, or just write it down on a piece of paper somewhere , or in a word doc-whatever your preferred format. It doesn't matter. As long as you DO it! This is the only way youc an improve as a trader, and moreover within technical analysis. Don't be afraid to draw on the charts, make predictions even if you don't have a clue what you're doing. We all start somewhere, and even those of us who have been doing it for many years, still do the same thing, or at least should -you never stop learning in this game. That's something that resonates thoughout life in general, and especially within the realm of something like Technical analysis, and trading. Even more so within the Crypto space. There's so much more volatility and un-predictable behaviors /manipulation that creates differing patterns than that of what you would see in the stock and or forex market- albeit there are crossover similarites, don't mistake me. But don't get bogged down in the minutia of it all.

AMPL/USDT CAN´T GET MORE EASE THAN THIS...
Seems AMPL/USDT Is on a ongoing range all the time.
BUY,BUY, SELL,SELL...
Not financial advice...

Will AMPL Coin Reach Among The Top 10 Crypto Assets?The weekly technical chart of the Ampleforth hints towards a strong upside momentum. On coming to the daily chart, the coin is trading in an upside parallel channel. The upside trend of the AMPL might face a setback near $1.5. Meanwhile, a bounceback near $0.6 can be seen. AMPL is currently trading below its major moving average and can soon jump above it in the future.

AMPL_USDTBUY LOW - SELL HIGH - the best strategy for this token . this token made me rich
trade safe
dont over leverage

ampleforth price behavior precedes short behaviorif you want a peek at the weekend, here's your picture. shorts will tumble, we'll get some nice wicks & the uptrend shall resume for crypto markets. barring any news...

AMPLUSDT Technical Analysis⏳ Spot
💎 AMPLUSDT has broken above the major resistance. We see several large green candles which indicates the bulls are in control. After the pullback we can expect another Bullish move
🌐 Tradingview
💵 Invest Only 5% of your Portfolio
🎳 Entry/Pullback now or from 1.03387 -0.91716
☕️ TP1 1.15590
🍺 TP2 1.32243
🍻 TP3 1.60244
🍾 TP4 1.81024
🍷 TP5 2.00000
🍸 TP6
🍹 TP7
🎁 TP8
🚫 SL 0.91716 - 0.79926
Good Luck 🎲
Check the Links in Description and if you LIKE this analysis, please support our page and Ideas by hitting the LIKE 👍 button. ❤️ Your Support is really appreciated! ❤️
Traders, if you have your own opinion about it, please write your own in the comment box. We will be glad for this.
Feel free to request any pair/instrument analysis or ask any questions in the comment section below.
We will have more FREE forecasts in TradingView soon
Have a profitable day 😊👍🏻

Ampl safe entryBuying at the lower line(and below) has proven correct in the past. Not financial advice

50% Move to the upside incoming for AMPL?All indicators showing a reversal incoming on Ampl.
Channel support here.
MacD impending reversal.
Stoch RSI bottomed and looking for crossover.
Squeeze indicator also showing reversal incoming.


AMPL in a steady updtrend
AMPL is in a steady uptrend since the May crash. It is the only token I found to have somewhat decoupling from the cryptomarket temporerally and continues to make steady profits since May. This may be due to the rebasing nature of AMPL. We can see AMPL has been fluctuating in a channel between ~0.7 and ~1.8 USDT over a long period of time. Currently it stands at around the mid point of 1.07 USDT. If this is the case, AMPL was, and still remains a very good investment, at least until we get a clear direction for the general market, as it is less susceptible to the constant BTC dips. Instead, by following its current uptrend, it is gaining very good traction against BTC (see the AMPL:BTC chart).
I expect one of two scenarios:
1. AMPL will continue up until it reaches ~1.8 USDT and then it will start declining. This is representative of the simplistic sketch I made in the chart. I suggest stop losses at around the current daily MA price. Expected profits can be around 50%.
2. New hype (e.g. AMPL being added on AAVE as a borrowing asset) may bring a surge of new liquidity into AMPL causing a price hike that may shoot price out of the regular channel and above 1.8 USDT. This won't last, but can lead to very high short to mid term profits (see AMPL:BTC for potential).
In any case AMPL seems like a very good investment for now.

My thoughtsAMPL has a clear cycle. I believe buying at 0.8 (or even right now at 0.9) should be very profitable.

Crypto|AMPL/USDT|LongLong AMPL/USDT
Activation of the transaction only when the blue zone is fixed/broken.
The author recommends the use of anchoring fixed the blue zone, this variation is less risky.
If there is increased volatility in the market and the price is held for more than 2-3 minutes behind the activation zone after the breakdown, then the activation of the idea occurs at the prices behind the activation zone.
The idea is to work out the resistance level .
* Possible closing of a trade before reaching the take/stop zone. The author can close the deal for subjective reasons, this does not completely cancel the idea and is not a call to the same action, you can continue working out the idea according to your data, but without the support of the author.
+ Maybe right now we will go even lower, then it's okay, the idea is not activated and simply canceled.
+ ! - zone highlighted by the ellipse is a zone of increased resistance, in this area there is a possible reversal for a correction, please take this factor into account in this transaction.
The "forecast" tool is used for more noticeable display of % (for the place of the usual % scale) of the price change, I do not put the date and time of the transaction, only %.
Blue zones - activation zones.
Green zones - take zones.
The red zone - stop zone.
Working out the stop when the price returns to the level after activation + fixing in the red zone.
Orange arrow - the direction of take.
Black arrow - neutral scenario without activating the trade.
The red arrow - the direction of the stop.
SUM PNL: This parameter displays the total % of all closed ideas of the "new" format (according to the author) for this sector at the time of publication of the idea. The calculation is very "clumsy" just the sum of the profits of all the ideas, based on this indicator, you can more accurately assess the risks when working with my ideas of this sector. I present you the construction of the idea, you can use it yourself as you like based on your subjective view and risks, the calculation of the PNL indicator is carried out only on transactions that the author closed on TV in manual mode or by take.
P.S Please use RM (risk management) and MM (money management) if you decide to use my ideas, there will always be unprofitable ideas, this will definitely happen, the goal of the system is that there will be more profitable ideas at a distance.


AMPL looks outstandingReady for breakout on the Daily chart & the 4H chart just put up a long buy signal.

AMPL looks outstandingThis looks really bullish. This is the daily chart & the 4H chart just put up a long buy signal.

AMPLBuying area aproaching.Jump up in the future.Sure thing. :) Better to wait for RSI below 40,..maybe.Or use DCA.


Long soon AMPL-USDTI think tillmid of april price will reach 1.5 usdt like its shown on previous chart. I will open position at this sunday 21. march.


