AMPUST trade ideas

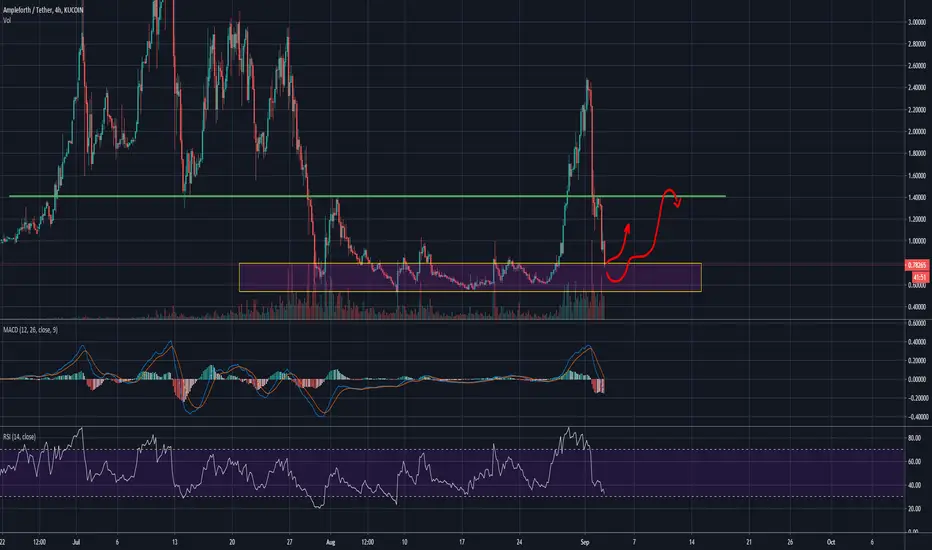
AMPL Road MapAMPL Now Near At 0.53 - 0.62 Which One Is The All Time Strong Supports Zone.
Total 6 time's AMPL Coin Pumped From This Support Zone 0.53 - 0.62.
This Time If Price Failed To Reverse From This Support Area It Could Be Take More Deep.
If Price Pullback From Above 0.53 - 0.62 Then U Can Sell Your Holdings At Upper Resistance.
U Can Check Also Strong Resistance At Upper Level.
It's Strong Because Price Retested This Zone Many Times.
I'm Not Your Financial Advisor. Verify Your Own Analysis.
If U Like My Hard Work Hit The Like Button....


AMPL preparing for a major move?AMPL Failed twice to break above of the descending triangle but showed strong support making higher lows. A Big decision is coming maximum in 2 days.
Will it finally manage break above this time?
WATCH AMPL MARKET CAP HERE
charts . cointrader .pro /charts.html?coin=AMPLEFORTH%3AMARKETCAP


Inverted chart analysisStrong divergences are building again, as we saw previously at the top. The RSI is continuing to follow a trend of higher lows. This is the exact opposite of the month long consolidation we had previously, where the RSI and MACD would converge downwards with the price until pumping quickly to reset the oscillators. We are not seeing many bearish signals in the indicators. Price should increase sharply soon. I have the price chart inverted for the purpose of helping you see through any emotions that may be leading you to believe that the price action might be dead. Technically speaking, we are preparing for an uptrend. It however is not guaranteed at all, just like any move in the markets that can be irrational.


Price outpacing momentum and MACD, sell pressure unsustainableAs the previous quick divergence finding TA showed that the positive momentum was unsustainable, we can now see that neither is the sell off. With this coin being in it's early stages with immature price volatility, I believe we will be seeing lots of gigantic trade opportunities until the price begins to oscillate around a fair value. Ampleforth may be one of those once in a lifetime opportunities where you can get make large gains quickly due to it's volatility and technical (literally the code that governs it) nature. The rebase feature of AMPL is being used by market makers to make these giant moves. Watch for divergences. Buy at lows. Sell at bearish divergences and support/resistance levels. Although be careful, as resistance levels are often shot past quickly, with TA favoring hidden divergences as selling/buying indicators.

Expecting a bounceEasy 50-60% gain after bottoming. If this base is a strong support level, expect an at least temporary reversal soon. Also don't hodl this coin, AMPL is not an investment lol
Unsustainable short termRegardless of how much the rebase function allows for this coin to make these really massive pumps, it will dump really hard in the short term as we've seen before, regardless of how much higher it might go. We're seeing strong bearish divergences stacking up right now as well with the volume and RSI moving away from the price, Higher highs on price, lower highs on RSI and decreasing volume. Those who benefited from the rebase 'inflation' will soon be cashing out big on the system.

Descending triangleThere will be a big move soon. Long or Short when there is a breakout with high volume.

TEXTBOOK CUP & HANDLE?Been watching this one for a while now, theres been a nice progressive consolidation period since the last run up to the $4 region. The top 100 wallets have been building nicely...
As always, I stand to be corrected but it looks like a textbook cup & handle could be in play!
What are your thoughts on this and the short term price targets? I can see us finding stability between $1.50 & $1.75 so the positive rebases can start rolling in again and then breaking even higher to the upside $4.00 plus.
ITS TEA TIME BOYS :D


AMPL Short time? Hi guys!!
Hit that like button xD
AMPL +100% in 2 days :D Is it time for correction?
1.39$ seems nice to open some short positions : )
I opened few small shorts already, just in case we got correction sooner.
Enjoy

AMPL USDTAMPL USDT in bullish wedge and inside of the wedge we are in a symmetrical wedge pattern which should make us break out of the big wedge this will make us break out to the up side we also above the 200 MA on the 30 Minute time frame also looking at the MACD we have a bullish cross on the daily and Stoch RSI also a bullish cross on the daily lots of signs for some up side.
Price of writing 0.63458
Target Prices
(1) 0.93303 Total of 47%
(2) 1.31989 Total of 107%
(3) 1.51021 Total of 137%
(4) 1.74897 Total of 175%
when you above target 1 i would set a stop loss so you are Risk Free in the Trade.
Not financial advise


AMPL Resistances and supportsAMPL after many tries is at the same time suppport and resistance, in a squize pattern. Wait for a move soon.

AS U CAN SEE FROM MY TA, AMPL IS going to the moon!Look at the flames from the rocket tail powered by rocket fuel from FOMO investors.

Ampleforth (AMPL) vs USD - Bullish divergenceFollowing an overbought condition (green column) and the subsequent 85% drop from $4 Ampleforth is now showing signs of reversal. The facts of the above 1-day chart:
1) The RSI resistance trend line that has been acting as resistance since July 1st until August 9th is now broken.
2) Stochastic RSI has now made higher lows that consequently diverge with lower lows in price action - this is regular bullish divergence.
3) The divergence occurs as volume enters the market - golden.
4) Price action has been trading inside a falling wedge until 2-3 days ago, and has now broken out. It does not indicate price action has found the bottom, but it does tell us price action is no longer restricted by the resistance trend line.
5) Lastly I like to see an asset is diverging against others, not just the one I'm studying. The 1-day Bitcoin chart below shows us the divergence also exists following an overbought period. This is a great indication.

Ive seen worse..Defi, one to moon and gloom but when it looks this good why not. Lots of these farm defi going on coinbase so could be next in which case , likely to exceeed that high and R2R is pretty good now, but that is 1:20+ area.

AMPL USDT LongAMPL has made a Double bottom on the 4Hr and there is a bullish engulfing which is a Bullish sign. I am expecting to see some upside. I Bought in at 0.58 and my target are
(1) 1.26339 total of 117.48% Profit.
(2) 1.75196 Total of 201.23% Profit.
(3) 2.35809 Total of 307.62% Profit.
Join my new Telegram: TradeNomad
Not Financial Advice do at own risk.
