Ankr | Chart Structure (Bull-Market Dynamics Explained)Ankr (ANKRBTC) grew more than 2,900% in its 2020/21 bull-market. The bull-run alone (2021) amounted to a strong 1,776% price jump... Amazing.
How are you feeling?
We have a new day, a beautiful day and the Altcoins market continues to heat up.
Let's mention the chart structure for this trade-idea.
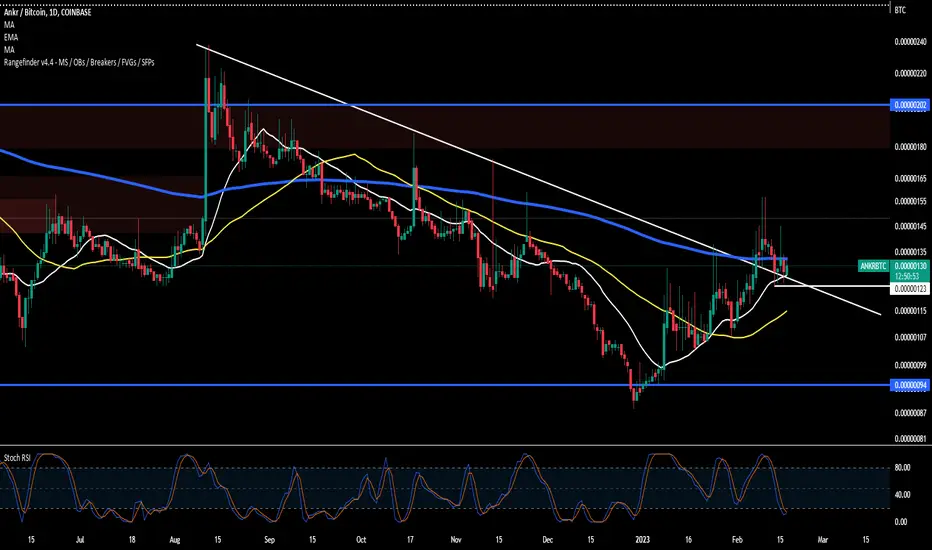
Notice how big the candles become during the bull-run phase of the bull-market. The candles are also quite big during the initial part of the bear-market. This is the left side, where it says "double-top" on the chart and around 2021 and early 2022.
As the market prepares to change the trend, notice how each time the candles become smaller and smaller, and trading volume starts to disappear.
We can predict a change of trend by looking just at these.
This means that the bearish phase is ending and once the bearish phase ends a bullish phase starts; the market always alternates between bearish and bullish, night and day.
What follows would be the accumulation phase.
Here is how things generally play-out:
1) Initial bullish breakout. One wave that is good but not super strong.
2) Higher low. The initial bullish breakout ends in a higher low.
3) Bull-run. Very strong growth for weeks or months ending in a new All-Time High or a new major peak.
This is exactly what we can expect for ANKRBTC next: (1) An initial bullish breakout that ends in a (2) higher low, followed by a very strong (3) bull-run.
Namaste.
ANKRBTC trade ideas

✳️ Ankr Network Early Call: Three Years Long Falling Wedge + ATHThe falling wedge pattern without a doubt is a bullish reversal pattern.
A breakout from a falling wedge can take its time to play-out which can be appreciated here as the pattern has been going for more than 1,000 days or almost 3 years.
Other than this pattern, what other signals point toward a reversal?
I can think of two right away:
1) Trading volume coming to a halt.
2) The rest of the Altcoins market.
Let's expand!
1) We have years of lower lows. As new lows are hit, trading volume continues to decrease. This tells us that the bearish trend is losing strength. If the bearish trend was set to continue, at some point we would see an increase in bearish trading volume when a new low hits. New lows but now new volume, means the trend is weakening.
2) I've been sharing dozens of Altcoins and many of these are already producing bullish breakouts. The market is connected, linked; What one does, the rest follows. A bullish breakout here similar to what is happening with other pairs would put ANKRBTC above EMA10 and thus activate additional bullish signals.
This is an early call.
We have a long-term higher low so a higher high (new All-Time High) is possible when the next bull-market ends.
Namaste.

ANKR/BTC - Ankr Network: BBand Breakout Super-Trend◳◱ On the $ANKR/ CRYPTOCAP:BTC chart, the Bband Breakout Super-Trend pattern suggests an upcoming trend shift. Traders might observe resistance around 0.00000096 | 0.00000108 | 0.00000135 and support near 0.00000069 | 0.00000054 | 0.00000027. Entering trades at 0.00000091 could be strategic, aiming for the next resistance level.
◰◲ General info :
▣ Name: Ankr Network
▣ Rank: 162
▣ Exchanges: Binance, Kucoin, Huobipro, Mexc, Kraken, Hitbtc
▣ Category/Sector: Services - Shared Compute
▣ Overview: A shared cloud economy driven by idle processing power
◰◲ Technical Metrics :
▣ Mrkt Price: 0.00000091 ₿
▣ 24HVol: 47.947 ₿
▣ 24H Chng: 3.409%
▣ 7-Days Chng: 24.94%
▣ 1-Month Chng: 57.56%
▣ 3-Months Chng: 115.63%
◲◰ Pivot Points - Levels :
◥ Resistance: 0.00000096 | 0.00000108 | 0.00000135
◢ Support: 0.00000069 | 0.00000054 | 0.00000027
◱◳ Indicators recommendation :
▣ Oscillators: NEUTRAL
▣ Moving Averages: STRONG_BUY
◰◲ Technical Indicators Summary : BUY
◲◰ Sharpe Ratios :
▣ Last 30D: 4.94
▣ Last 90D: 3.40
▣ Last 1-Y: 0.89
▣ Last 3-Y: 0.17
◲◰ Volatility :
▣ Last 30D: 1.42
▣ Last 90D: 1.03
▣ Last 1-Y: 0.77
▣ Last 3-Y: 1.12
◳◰ Market Sentiment Index :
▣ News sentiment score is N/A
▣ Twitter sentiment score is 0.63 - Bullish
▣ Reddit sentiment score is 0.89 - V. Bullish
▣ In-depth ANKRBTC technical analysis on Tradingview TA page
▣ What do you think of this analysis? Share your insights and let's discuss in the comments below. Your like, follow and support would be greatly appreciated!
◲ Disclaimer
Please note that the information and publications provided are for informational purposes only and should not be construed as financial, investment, trading, or any other type of advice or recommendation. We encourage you to conduct your own research and consult with a qualified professional before making any financial decisions. The use of the information provided is solely at your own risk.
▣ Welcome to the home of charting big: TradingView
Benefit from a ton of financial analysis features, instruments and data. Have a look around, and if you do choose to go with an upgraded plan, you'll get up to $30.
Discover it here - affiliate link -

$ankrlonged this bubba on this dip
no sign of strength yet on usd pair below 200 ema after attempting to reclaim it
who knows may just close above tonite
either way btc pair gives a good indication of where we are at and this has no good thing going for it yet but the stoch looks to be bottoming out
dominance nuking is what i am looking for so corn can form a range and some love can flow in to the forgotten .
looking for .089c as a swing play for when stuff does go loco

✳️ Many Options, Trading, Opportunities, ALTSBTC & More | 150%+Many options, many opportunities.
The good, great, positive, nice or very awesome part is that these pairs, Altcoins vs Bitcoin, are breaking out in huge candles. I am seeing a 30% to 50% jump on the initial breakout which tells us that this bullish wave will be really strong, it should go for weeks if not months.
✔️ Many of our pairs bleed out but many more stayed within higher lows like this one, ANKRBTC.
Higher low or lower low short-term, March vs Dec.2022/Jan.2023 is immaterial, it is all a waiting game.
The mistake would have been those trades from late February until early March but that's the mistake that can be corrected through waiting.
A trade can only be considered failed if it goes below the stop and many are bound to fail as many more are bound to become a success!
On a different perspective, there is always a second chance and a third one and forth and so on through infinity.
Now, it goes up and down, up and down...
Will you sell or hold?
Just know that if you don't sell when the prices go up, then you will have to hold for weeks or months while prices go down and then another wave.
This keep on happening long-term.
This pair is showing a 150% potential but the charts can always change.
How you approach it is up to you.
I share some tips and strategies and the learning process takes a while, overtime, with experience we learn.
We have a volume breakout.
The chart looks beautiful, simple, a clear picture.
Namaste.

#ANKR/BTC - Long - Potential 21.01%Style: SWING
Direction: LONG
Market: SPOT
Risk: 0.25% - 1%
EXCHANGE: BINANCE
#BTC_ANKR
TIMEFRAME: 720
ENTRY: 0.00000137
⎿ TP2: 0.00000167
⎿ TP1: 0.00000152
STOP: 0.00000122
Late publishing but still viable. Classic volume trend breakout. 100% at TP1 though as with thin volume over the weekend trading against BTC is always tricky!

#ANKRBTC - 15 to 20% Drop Closing InComing off the back of a recent very profitable Long trade it appears we're bouncing off resistance and a historical level of SR to the downside once again.
We'd expect somewhere between 15-20% on this Short before taking profits at the next support level on the underside.
If you enjoyed or agree with this idea - drop us a comment, like & follow! 😀
Ideas by theCrypster should not be considered as professional financial advice ✌️

$ankr looks tempting as long as we hold today's low looks to be headed up to blue line or range high
nice r/r
daily stoch crossing flip 200 ema retest it the break range high imo
ANKR- Inverted Hammer Candlestick Pattern (to be valided)
- Potential monthly cup & handle in formation (to be valided)

AnkrbtcHi. We see a cup & handle pattern that is very bullish after breakup. Potential's price up to 200% or above.

ANKR vs BTC (and USD)This is a very new project so not much history to go on. However a number of indicators caught my attention, the volume being one. Both on BTC and USD weekly charts. Volume increasing and by no small amount, 24-hour volume @ 30% of the current market capital. The volume follows a strong oversold period, marked in orange and dark orange above. Furthermore, support on the ever important 21-week moving average is established on both weekly charts, this price action looks set to explode.
On the 3-day chart above we can see the bullish engulfing candle follows the oversold period with higher lows on the RSI. On the 1-day chart below the Bollinger Band is converging as price action finds support on the bullish half of the band. This indicates to us a big move is coming.
Downside risk? Yes. However the probability is remote. I'm basing this on a recent bounce from the 0.786 golden ratio.
1-day chart
Weekly USD showing Dragonfly DOJI on 21-week moving average.

ANKR formed big bullish Gartley | A good long opportunityHi dear friends, hope you are well and welcome to the new trade setup of ANKR token with Bitcoin pair.
Previously I shared a long-term trade setup of ANKR, which is still in play:
Now on a 4-hr time frame, ANKR has formed bullish Gartley pattern.
Note: Above idea is for educational purpose only. It is advised to diversify and strictly follow the stop loss, and don't get stuck with trade

ANKR/BTC READY TO PUMP 50-60%Hello everyone, if you like the idea, do not forget to support with a like and follow.
Welcome to this ANKR/BTC TRADE setup. ANKR looks promising here.
ANKR is breaking out from the falling wedge in the daily time frame. A retest is also done. Currently, it is holding the 21D ma very well. I'm expecting a good bounce from here.
Buy some now and add more in dips.
Entry range:- 172-182 sats
Target1:- 200 sats
Target2:- 222 sats
Target3:- 244 sats
Target4:- 272 sats
SL:- 160 sats
If you like this idea then do support it with like and follow.
Also, share your views in the comment section.
Thank You!

A CLEAR CHANCE! well ankr is getting a lot of attention recently and have a lot of publishing coming and it's so positive for buying now at 80 SAT
BUYY AND HODL THIS FOR AT LEAST 100%
PS: follow the FIbo ret for taking profits

TRADE SETUPANKR looks like it could have a nice move on the 4H time frame.
Entry - 215-218 (Purple Box)
Stop - Under 209
Take Profit - 233-244 (Green Box)

ANKRBTCHello Crypto Lovers,
Mars Signals team wishes you high profits.
As you can see the price has been able to break its resistance line and that line is acting as a support. As long as it is fluctuating above the support line, it can attack the resistance line and touch our target.
Warning: This is just a suggestion and we do not guarantee profits. We advise you analyze the chart before opening any position.
Wish you luck

ANKR is testing an important resistance against BTCANKR/ BTC is printing a huge cup and handle pattern on the weekly chart. This cup and handle pattern will be confirmed only if a weekly candle closes above 0.00000303 and the pattern projection and the target will be around 0.00007057 then


ANKRBTC is testing the 4h resistance ANKRBTC is testing the 4h resistance inside a falling wedge.
IF the price is going to have a breakout, According to Plancton's strategy (check our Academy ), we can set a nice order
–––––
Follow the Shrimp 🦐
Keep in mind.
🟣 Purple structure -> Monthly structure.
🔴 Red structure -> Weekly structure.
🔵 Blue structure -> Daily structure.
🟡 Yellow structure -> 4h structure.
⚫️ Black structure -> <4h structure.

AnkrbtcHi. We see ankr is forming a cup pattern and now we set order with minimum risk.buy in dipp and take profit. Target is about +300% this price.


ANKR/BTC buy opportunityHi followers,
ANKRBTC Formed beautiful double bottom, which followed by structure breakout with higher low.
We may be ready for the next big move up, let me know what do you think?
Don't forget to manage your risk! 👌
Good luck and trade with care 🙏
If you like my content - 👍 Like, 💬 comment, 👆 follow and 👉 share!
❗❗❗
Disclaimer: This information is not a recommendation to BUY or SELL. It is to be used for educational purposes only!
