ANKR/BTCIn the name of Allah
entry point: now
targets: red lines
stop loss: close daily candle under 21
hope good things happen
ANKRBTC trade ideas

ANKR/BTC | 70-80% Profit Potential..!!ANKR/BTC
Forming Falling Wedge & Printing Bullish Divergence As well in Bigger TF Chart.
In Case of Breakout, It Might Test 40 Sats..(Need Patience)
EMA21 is First Major Resistance.!!
Buy Zone 22-24 Sats
Sell Targets 28-32-36-40 Sats
Hold Time : 15-28 Days
Please, give us your opinion in the comments.!!
If you like the idea, please hit the Like button and subscribe to the profile in order not to miss our updates.
The information given is never financial advice. Always do your own research.

ANKR/BTC (Up to 122% Profit Target)ANKR/BTC
This coin has been in a free fall since launched and now it is consolidating for 80 Days already. The RSI has shown Bullish Divergence and volume is starting to pick up.
The fact we are trading just barely above 50 Day MA and scouting for potential Higher Low if we can see a little pump to the 32 Sats price.
This coin as a chance to change the market trend in the coming week or two. As long as BTC Dominance will not break Bullish
Trade setup
Buy area: 28 Sats - 24 Sats
Sell target: 32 Sats - 53 Sats
Stop loss: 19 Sats
Don't forget to click on the thumbs up button
Follow my channel for future Altcoins TA updates
www.tradingview.com
Join Free Trading Community Chat Group
t.me
Trading is simple, don't over complicate things :)

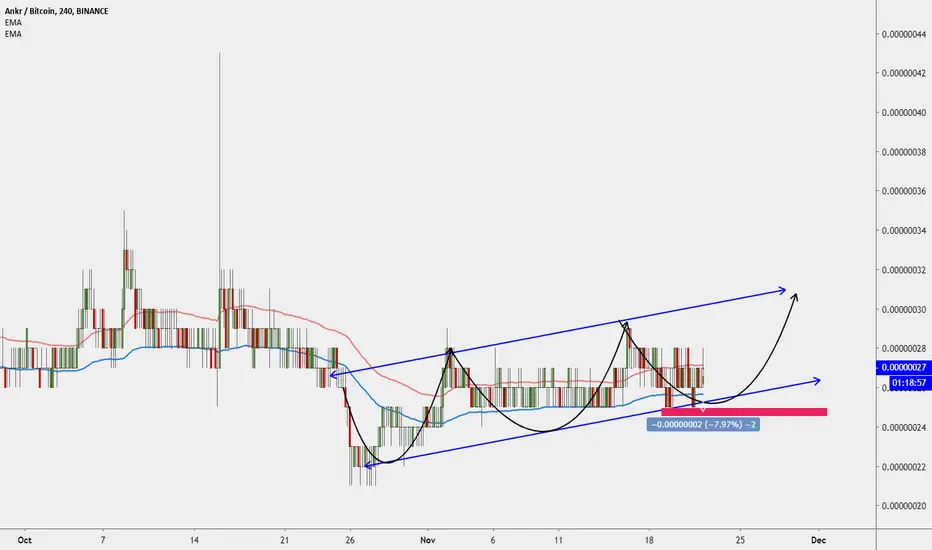
#ANKRBTC (Mid Term) 11/19 2 #ANKRBTC (Mid Term)
Buy : 0.00000027 - 0.00000026 - 0.00000024
Target 1: 0.00000028
Target 2: 0.00000031
Target 3: 0.00000036
Target 4: 0.00000046
Stoploss: 0.000000235
Invest: 3%
Risk/Reward: 7% / 70%
Current Signal
we ask Allah reconcile and repay
Ankr Network Getting Ready For Round 2 | Easy 50%Ank Network (ANKRBTC) is now above EMA300 (bold gray line) on the 4H timeframe chart...
Look at the far left of the chart in a yellow circle, we can see the attempt to break above EMA300 with over 30% of growth above this indicator.
Now we are seeing ANKRBTC move above this same indicator again... If ANKRBTC can close and remain above it, we can see easily see 50% or more of growth.
Additional details can be seen on the chart.
Thanks a lot for your support.
Namaste.

#ANKRBTC (Mid Term) 11/19 #ANKRBTC (Mid Term)
Buy : 0.00000026 - 0.00000025 - 0.00000024
Target 1: 0.00000028
Target 2: 0.00000030
Target 3: 0.00000038
Target 4: 0.00000045
Stoploss: 0.00000023
Invest: 3%
Risk/Reward: 8% / 73%
we ask Allah reconcile and repay

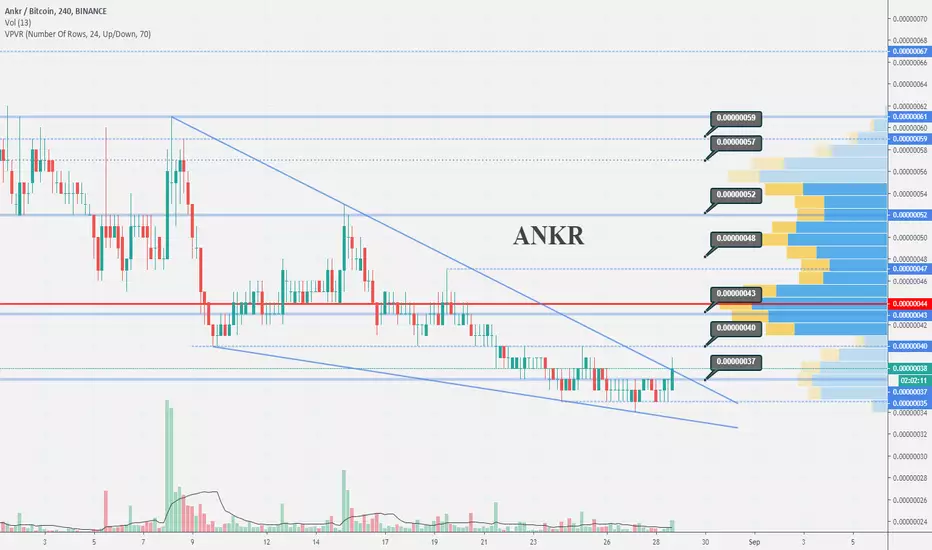
ANKRBTC hits resistance of wedge | Upto 23% short opportunityThe priceline of Ankr / Bitcoin is moving within a falling wedge and has hit the wedge's resistance and also 100 simple moving average resistance and likely to fail in breakout.
MACD turned weak bullish from strong bullish soon it will be turned strong bearish.
Stochastic has given bear cross.
We can buy back from the support of wedge however I will post a buy back plan soon insha Allah.
Regards,
Atif Akbar (moon333)


ANKR - We are getting thereAfter a lot of consolidation, we are finally making a move on the upside.
Targets on the chart.
With altcoin season it can happen in a single day or a week.

[ANRKBTC](70%) Ankr Trade Signal @alanmastersHere we are seeing a clear break of the "major trendline" for Ankr (ANKRBTC).
I promised to share a trade for you all once this one started to move. There is a good chance here for additional bullish action.
Below you can find the trade details, remember to like and comment...
-----------------------
PAIR: Ankr (ANKRBTC)
ENTRY: 33-35 (34)
TARGET:
(1) 39
(2) 43
(3) 46
(4) 51
(5) 54
(6) 58
PROFITS POTENTIAL: 70%
STOP: Close weekly below 27.
-----------------------
Thanks a lot for your continued support.
Namaste.
---------
THIS IS NOT FINANCIAL ADVICE

$ANKR - Descending Resistance Will be Broken!The coin should broke the descending resistance which was mentioned on the chart. Why? Because of the convergence which will help $ANRK and give strength. After breaking through the descending resistance we would see fresh buy volumes and a new strong upward impulse . Targets are on the chart.

ANKR breaking falling wedgeI don't know why it looks like that, but despite the whole market bleeding ANKR looks like bouncing (while breaking falling wedge). If not the BTC on the backside, I'd say it can get to 42-43, but tight now I am not sure. Certainly worth watching
ankrprice now =0.00000035
case 1(green way ) :price now on bittrex =0.00000042 if in binance price can hold 0.00000035 i expect price will go to 0.00000042-43
case 2( red way ): if price cant hold 0.00000035 then will go to 0.00000025 or 0.00000019 according chart in bittrex

ANKRBTC RSI Bullish divergencei think 36 sats is very good entry for this coin if you want to buy you can buy at 36-37 sat place your bid and let's goto moon together

signal for ANKRBTC short time frame.Buy ankr partialli between 36-41 satoshis.
7-58 % profit in short time.
#buy and #hold.
Targets:
1- 44
2- 48
3- 53
4-65
take stoploss: 32 satoshi.

ANKR (Ankr Network) Bottomed Out...!!ANKR (Ankr Network)
- Getting Ready to Bounce Back From Here.
- Facing Tiny Resistance At Here (46 Sats)
- Major Indicators Looks Bullish (MACD & RSI)
Buy Around 42 - 44 Sats
Sell Targets 56 - 65 Sats
Stop Loss Below 38 Sats
Please, give us your opinion in the comments!
If you like the idea, please, hit the Like button and subscribe to the profile in order not to miss our updates.
Join Telegram Channel for more analysis - t.me
The information given is never financial advice. Always do your own research

Ankr/Bitcoin (Aug 14) #ANKR $ANKR #BTC $BTCANKR is not in good situation now. It has a big possibility to come back 40sts
At 40sts zone, we can take risk to buy it
- If 40sts can hold it, we will see ANKR at 50-51sts
- But if price is lower than 40sts, we will see ANKR at the zone of 30-33sts


ANKRBTC CHART UPDATE COST AV ADD READ COMMENTlast cost av. now is a matter of waiting as market pump trendy coins. I expect it to have the same outcome as COS and DUSK


ANKR/BTC 17-20% potentialShort term trade for a 17-20% gain
Entry @ 55-56
Exit as shown
Tight stop loss as shown

Ankr/Bitcoin (Aug 09) #ANKR $ANKR #BTC $BTCBuy : 42-43
Sell : 50-60
Mid-Hold : 65-73-80
Stop : Under 39
