Elliot and ichimoku checking for ankrAnkr try to hit another time it's lowest bottom and the bounce back, from the ichimoku aspects, we see that the bearish movement of ankr will continue and the strongest point for it entry would be it's lowest point. it must be checked from different aspect before entering the trade. it is just my point of view about Ankr at this point.
ANKRBTC trade ideas


Ankr Network (ANKR) Challenging ResistanceOn Dec. 16-17 we can see a strong bearish candlestick pattern on the ANKRBTC chart.
This pattern was quickly invalidated the following day with a strong, high-volume bullish candle.
Now we have prices trading above EMA10 and EMA21 while aiming higher.
This one is starting to look good.
Support is found on the blue and red dashed lines.
The next target is marked with a magenta dashed line.
This is not financial advice.
Good luck!
Namaste.

#ANKRBTC (Long Term) 12/20 #ANKRBTC (Long Term)
Buy : 0.00000051 - 0.00000044
Target 1: 0.00000056
Target 2: 0.00000069
Target 3: 0.00000089
Target 4: 0.00000128
Stoploss: 0.00000043
Signal R/R: 9% / 151%
Net ROI : 50%
Invest / Position Size : 3%
Exchange : Binance
Duration: 15-90 days
Confidence in Trade : Low
we ask Allah reconcile and repay.


ANKR/BTC back to weekly support againANKR / BTC
price dropped again to weekly support
Falling wedge spotted
These are Bullish Signs but not enough
Take into consideration
this is low satshi coin = mean pump is hard due to heavy sell orders placed
Also its x6 times it visits this support = bulls exhausted
Not a buy area until the bulls prove them self here with strong bullish signs and price became above ema20 at least
Otherwise if bulls lose this support there will be parabolic drop in ANKR because next support is far
always have a plan dont trade blindly
have a nice day
Good luck and happy trading 🌹


Lets go ANKR!I predict Ankr will go to the top 50 market ap at least. which will be around 6 cents ish at 350 million.
In this kind of patters BTC will do down and alts go up!
Fact
seeing the fundamentals compared to other ones in this list and how much this is needed in the cryptocurrency space this is definitely one to look at in the ( near ) future and beyond
Happy trading folks

Ankr Bullish Setupprice is holding very well at retest
44 is very good weekly support which can hold here for long term

ANKR Breakout price break the trend line and now ready to move higher
Buy : 55 - 58
Stop : 35
Target : 65 , 80 , 95 , 110 , 130 , 155

Ankr price at Support zoneprice now at weekly support zone holding it perfectly and trying to bounce from we need breakout of trend line
after breakout add the retest of the trend line and we are ready to go with stop below support zone
here's the weekly support zone


ANKR Daily Chart: Ready to Launch!ANKR seems bullish as it has almost done its correction. Another possible scenario is another dip to mid-trend support and bounce back to the top and break the channel

ANKR is at a crucial lvlDue to the Bitcoin bull run, alts are in trouble right now. ANKR is at a crucial lvl and needs to hold support at 40 satoshis. Otherwise, things will get worse and we'll see 30 satoshis then.
Please like and share my idea.
Thanks.

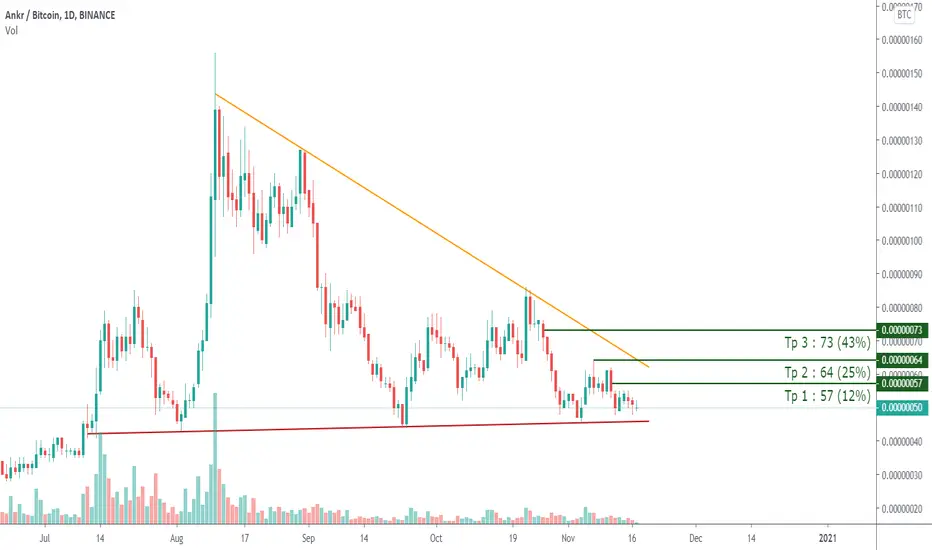
Expect The Breakout Soon❕ Overall Pattern Is Ascending Triangle ,Bottom Of The Support ,Expect The Breakout Soon ,High R/R
✅ Targets On The Chart
🔴 Stop loss zone : 45 ~ 44
ANKR , sleeping beauty is ready ..get a small bag here and add more after the breakout and close above 63
daily close below 46 and get out of this trade
target 98 (80%), 120 (20%) next

ANKR Perfect Setup for pumpANKR is looking to buy here. The coin at major support and bounced back from there. We will see a retest of the downtrend line. Use tight stop loss below the major support level.
Buy Zone: 51-53
Target: 59-64-71-77-85
Stop Loss: 44

Opening a Long Position Is Quite Risky Here Overall Pattern Is a Descending Triangle
The Price Is Staying At The Support Of 45 Sat ,From Where It Can Easily Bounce Up To The 85 Sat Resistance .Opening a Long Position Is Quite Risky Here ,We Will Share a Signal For It When The Price Took Hold Above The 64 Sat Resistance
