ANKRUSDT is testing the key levelThe current price action of ANKRUSDT indicates an interesting development as it tests the weekly resistance level. This resistance level has significance in the market as it has previously prevented the price from moving higher.
After an initial attempt at breaking out above the resistance level, the price of ANKRUSDT has retraced back to test it again. This suggests that the market is in a critical phase, awaiting further confirmation for a clear breakout. One important factor that is needed for a successful breakout is increased volume. Higher trading volume can provide additional momentum and market participation, indicating a stronger trend.
According to Plancton's Rules, a potential trading opportunity could arise if ANKRUSDT manages to break out above the resistance level at 0.026. This level serves as a key threshold that, if surpassed with sufficient volume, could indicate a new bullish trend. Traders adhering to Plancton's Rules might consider opening long positions once the breakout is confirmed.
In terms of price targets, the first target for the long position could be set at 0.029. This level represents a potential area of significant resistance or a subsequent price target where traders might consider taking profits or reassessing the market conditions.
–––––
Follow the Shrimp 🦐
Keep in mind.
🟣 Purple structure -> Monthly structure.
🔴 Red structure -> Weekly structure.
🔵 Blue structure -> Daily structure.
🟡 Yellow structure -> 4h structure.
⚫️ Black structure -> <= 1h structure.
Follow the Shrimp 🦐
ANKRUSDT trade ideas

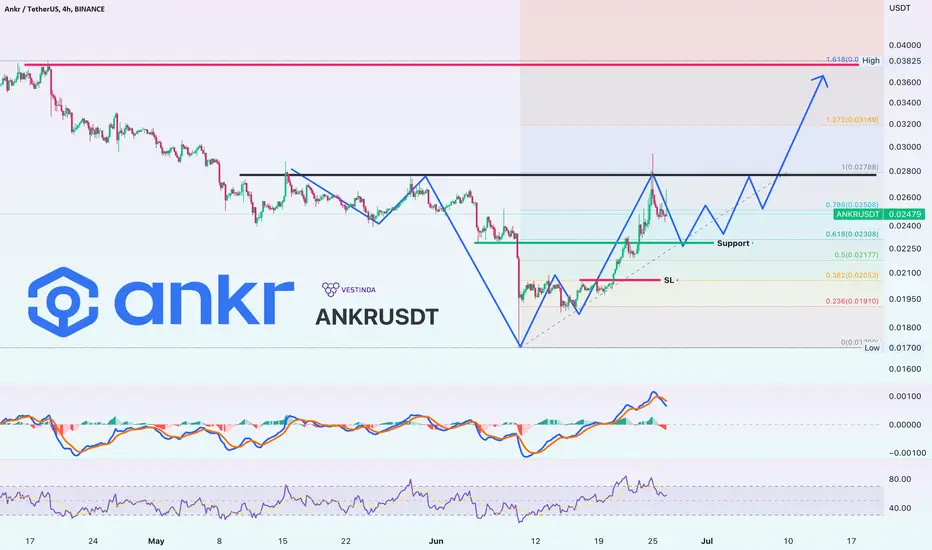
Ankr ANKRUSDT Price Analysis (4h)After experiencing a sharp drop in early June, the price of ANKR is currently rebounding.
The swing low occurred at $0.017, followed by a surge up to $0.029, marking a remarkable increase of +70%. As the price stabilizes, we anticipate a period of consolidation with potential support around the Fibonacci retracement level of approximately $0.023, indicating a trending market.
Furthermore, it appears that ANKR is forming an Inverted Head and Shoulders pattern, a bullish reversal pattern that suggests a potential booming phase.
This pattern, combined with recent fundamental news of ANKR partnering with Tencent, the largest entertainment and telecommunications company in China, raises expectations for future growth.
Be on the lookout for a strong price pump!
ANKR forming cup and handles ANKR is forming a cup and handles pattern in 4H time frame. Upon confirmation it can go up to 0.033, you can open long position at 0.024 at your own risk!

Finally Ankr showing Signs Of Life Forming 2 Pattern At Same Time Forming descending Channel While Breaking Falling Wedge too Once both Got cleared Bounce will Be epic Incase Of successful breakout expecting 5 to 6x in midterm

ANKR - Doom not overMy primary count considers that we should be finishing light blue wave 3. I´ll only be looking for shorts on any correction to the upside.
Note that there is not RSI divergence, which also leads us to believe the drop is not over yet.
First major resistance lies at 0.025.

ANKRUSDT is testing the key levelSTORJUSDT.The market for STORJUSDT is undergoing a crucial phase, with the price testing the dynamic support level around the 0.02300 area.
The dynamic support at 0.02300 signifies a significant price level where buyers have historically stepped in to prevent further declines. This level is being closely observed by market participants as it has the potential to influence the future price action of STORJUSDT.
In this scenario, there is a possibility that a pullback could occur around the 0.02600 level. A pullback refers to a temporary price reversal against the prevailing trend. If the market pulls back to 0.02600, it could attract selling pressure, resulting in a potential decrease in the price.
However, according to Plancton's rules, if the price of STORJUSDT fails to maintain the support at 0.02300, it could indicate a bearish signal. This breach of support would imply a shift in market sentiment and might trigger a new short position, indicating an expectation of further downward movement in the price.
In terms of price targets, if the support at 0.02300 is lost, the next possible target according to Plancton's rules could be around 0.02000. This level represents a projected point where sellers might aim to push the price further down.
–––––
Follow the Shrimp 🦐
Keep in mind.
🟣 Purple structure -> Monthly structure.
🔴 Red structure -> Weekly structure.
🔵 Blue structure -> Daily structure.
🟡 Yellow structure -> 4h structure.
⚫️ Black structure -> <= 1h structure.
Follow the Shrimp 🦐

ANKR/USDT scalp LongHi There traders and traderers....
Today I would like to start with this coin, because it shows clearly the Use of my Indicator whitcih I´ve put together long time ago and been trying to understand it ever since.
This Indicator creates a dark cloud whitch and whenever is up,, while all collors are inside of the cloud shows me that I should wait till the blue and green collors are out of the cloud and then I look for bullish divergence on MacD. Once I have all of those whitch is at about now, I open a Long position with Stop loss bellow the lowest point in trend. Let me know what you all think and if there is anybody who could code this into simple signals.... I would share this indicators details with him.

Second Long for ANKR After a Successfull TradeMEXC:ANKRUSDT.P
The link of last analysis on the below. It was a successfull position ended up with TP2.
Then now we have a possible bigger reversal in same way. 0.023 is also the macro golden pocket level and we have a buttefly setup that completes at this level.
Let's make them easier with a solid bullish price action signal.
Good Luck Everyone!

Bullish Setup Intraday for ANKRMEXC:ANKRUSDT.P
Do not miss out!
With the power of price action signal, we can use bullish harmonic pattern + libra.
Good Luck Everyone.

ANKR USDTAnkr Usdt Breakout successfully
Long Ankr Usdt
Entry 0.02597, 0.02510
TP: 0.2675, 0.2790
SL: 0.2427

ANKR - Preparing another leg downIn the 1-HR timeframe, after making a lower low without RSI Divergence, price began correcting forming a rising wedge pattern.
Therefore, my expectation is that we will have another leg down to retest the recent low at 0.2531.
There could be a fakeout above trendline resistance, but if it happens, I expect it to fail. My trade triggers would be a break below trendline support or recovery from a fakeout.

Watching for a potential bounce on ANKRJust thought this was a potentially interesting area to keep an eye on for this coin.
RSI and MACD showing signs of oversold / better value. Be interesting to see what it does from here.

ANKR (ANKR) WCA - Inverted Head and Shoulders PatternHello and thank you for taking the time to read my post. Today, we analyze the ANKR chart with the ticker ANKR/USDT on the weekly scale, focusing on a classic price pattern called "Inverted Head and Shoulders."
Inverted Head and Shoulders Pattern:
This pattern consists of three parts, always in the same order: the left shoulder, the head, and the right shoulder. These can be sharp or rounded. Ideally, the shoulders should have symmetry, which makes the pattern easier to identify. The bottoms between the troughs form a recognizable trend line. Additionally, we have a trendline called the neckline, which acts as the current resistance line. Technicians refer to this line as the neckline. Ideally, the neckline should be horizontal.
Chart Analysis:
Upon examining the ANKR (ANKR) price chart, we can clearly see that this classic price formation is taking shape. The neckline can be found in price terms at 0.04881. The formation can span from weeks to months, making this more of a watch-list candidate than a direct trade.
Moreover, the weekly 50 EMA is also moving downwards and is clearly rejecting the price, providing yet another reason to observe rather than to trade at this time.
The pattern exhibits the necessary criteria and symmetry between the lines. Although we cannot predict when or if the price pattern will break out, we can certainly prepare for it.
Conclusion:
The ANKR (ANKR) weekly chart showcases a classic Inverted Head and Shoulders pattern with a neckline at 0.04881. Although the exact timing of a breakout remains uncertain, the pattern provides valuable insights into potential market movements. By closely monitoring the neckline and the downward trending weekly 50 EMA, which is rejecting the price, traders can be better prepared for any potential price action in the future. As always, it's essential to consider risk management and proper position sizing when trading based on chart patterns.
Please note that this analysis is not financial advice. Always do your own due diligence when investing or trading.
If you found this analysis helpful, please like, share, and follow for more updates. Happy trading!
Best regards,
Karim Subhieh

ANKRUSDT BREAKOUTANKR bread 1HR low time frame momentum turning to bullish Use low equity since sl is more.

ANKRUSDT likley to head up to weekly resistanceThe price has been trading in and above the daily support zone for a few days. The likeliness of the price to move up is higher here and therefore, a long is favorable here. The target of this long should be the weekly resistance zone. The conservative target would be the start of that weekly resistance zone around 0.4480.

Ankr longthis coin will pupm very good :)
its risk trade use only 0.5% from your capital
this is not financial advice

Ankr Preparing For Massive Recovery Seems Like Already Prepared For Decent Recovery
Formed Descending Channel In 3 Days timeframe Incase Of Breakout expecting 280 to 300% Bullish Move Keep Eyes On Ankr For Breakout

New idea for $ANKR$ANKR
The protocol represents the Liquid Staking Derivatives category, from the same category $LDO & $RPL, which are performing better than the market 12-15% growth for the day.
A safe entry point would be after a consolidation above the green zone.
MACD momentum is upward and only starts at 1h & 4h
Working out time is approximately 2-3 days
Don't forget about risk management!

Fast LONG on ANKRFast LONG on ANKR - hello, I'm testing a combination of my MA and EMA + super script from EP tradingview selection, if it's successful I'll let you know and explain.
This is not a financial recommendation and I can be 99% correct. PS I recently looked at binance at the total balance of top traders on futures and therefore no glory, pretty much everyone is in the red.
Testing mode

I would bet that the ANKR will not make a significant move nowIf it were up to me, I'd say the ANKR will move sideways (orange line). We'll see what the Shanghai upgrade to ETH does and what effect it will have on ANKR. Next up will be some news regarding TENCENT METAVERSE, who ANKR has partnered with and has already started distributing these tokens, which are not yet open to the public. We've already learned several times that news won't reliably keep ANKR at new levels, so let's trust that BTC and ETH will keep rising, which could mean a clear path for ANKR to the upside.

ANKER Not sure we are going to recover in short term more likely we'll see clos above 0.023
let's see

ANKRUSDT : a possible scenarioA H&S pattern is formed and it broke the neckline downwards. A retest of the neckline has also been done now. Expecting a target to 0.0325-0.03200. Not a financial advice. DYOR before trading.
cheers

ANKRUSDT hit weekly support, likely to bounce to daily resistThe price has hit the weekly support and it is likely that the price will bounce from here. I believe it will head for the daily resistance 1 zone with L1, S2 and L3 sequence. However, let us focus on L1 first and then we reevaluate it further.
