Trade Signal: APEBTC Buy OpportunityDirection: Buy
Enter Price: 1.37E-05
Take Profit: 1.417E-05
Stop Loss: 1.318E-05
Based on our analysis using the EASY Quantum Ai strategy, we have identified a potential buy opportunity on the APEBTC currency pair. Several key factors contribute to our bullish outlook:
1. Momentum Analysis: Recent momentum indicators suggest increasing buyer interest. There has been a noticeable uptick in trading volume, indicating potential continuation of upward movement.
2. Support Trendline: APEBTC has been respecting a long-term support trendline which adds confidence to the current upward trajectory as it bounces off these zones.
3. Market Sentiment: Positive sentiment surrounding the APE ecosystem, as reflected across various cryptocurrency platforms, supports the probability of a price increase.
Make sure to manage your risk accordingly and avoid over-leveraging. As always, it's crucial to stay informed about market news that could impact this trade. Good luck, and may the pips be in your favor!
APEBTC trade ideas

ApeCoin: About To Grow 2,000? Let's Ask The Chart!The last target on the chart reads 2,000%, I didn't realize it was so high until I started to plot the price range tool, because I extracted these targets manually.
The entire drop, from April 2022 through August 2024, amounts to almost 99%. That is, APEBTC lots 99% of its value compared to the price at which it trade just two and a half years ago.
It also works in reverse. The bear-market can be brutal, the bull-market can produce amazing growth... You see, flip a coin and it turns.
➖ When it goes down, it goes down.
➖ When it goes up, it goes up.
The 2,000% target sits around the same level where consolidation happened before the major bearish run. Based on technical analysis, this is not only do-able but highly likely. This is how high APEBTC is likely to reach on its next bullish run.
Or it can go even higher...
Thank you for your continued support.
Namaste.

Apecoin 2 Years Long Downtrend Likely Ending...Early signals I should say because things can always change...
Apecoin (APEBTC) moved and closed recently above EMA50, opening potential for mid-term growth. With a close above EMA100 this potential would be confirmed but we are not quite there yet.
We have a bottom pattern, average volume and a strong RSI.
These signals are good but the really important part is the market cycle.
You can find tons of bullish signals just to see them reverse in a matter of days.
Since the charts are always changing, only a few days are necessary to change the picture completely and for this reason we tend to use a stop-loss point.
➖ Below the All-Time Low, we either stay out or know we have to wait before prices grow; in this case 0.00002700.
➖ Any trading above this level and a bullish wave can develop anytime.
Seeing all those pairs breaking up strong —ALTSBTC— we have a higher level of certainty that this time around we will win.
What to do if prices move down rather than up?
Either sell at a loss or wait patiently... That's all.
Thanks a lot for your support.
Namaste.

APEBTC.4HBased on the given market data, it appears that the APE/BTC pair is currently trading in a moderately bearish zone. The current price of 0.000032 is slightly above the 4-hour support level of 0.000031 and below the 4-hour resistance level of 0.000035. This indicates that the market is somewhat volatile and there is a possibility of a price swing in either direction.
The 4-hour RSI (Relative Strength Index) is at 40.51, which suggests that the market is neither overbought nor oversold. This neutral RSI value indicates that there is no clear buying or selling pressure at the moment.
The 4-hour MACD (Moving Average Convergence Divergence) is at 41.0, which is above the signal line and indicates bullish momentum. However, the 1-day MACD is at 49.0, which is relatively high and might indicate overbought conditions, suggesting a potential price correction.
The 7-day RSI is quite low at 29.28, indicating that the market is oversold over a longer timeframe. This could suggest a potential upward price movement in the near future.
In conclusion, the market situation for APE/BTC appears to be mixed. While some indicators suggest a bullish momentum, others indicate a potential price correction. Therefore, investors should proceed with caution and consider their risk tolerance and investment objectives before making a decision. As always, market conditions can change rapidly, and it's essential to stay updated with the latest market trends and news.

✳️ ApeCoin Hits Bottom (Beyond 210% Potential)Here is an interesting chart... When you look at it from this perspective, APEBTC, is there a way to know if it bottomed?
This week of course is green and also a Doji and we have some volume coming in, which is the highest volume bar weekly since January, other than that there isn't much to look at.
Now let's focus our attention on the main chart above, APEBTC 1D, here we can find additional signals.
Let's start:
1) The All-Time Low 13-July has less volume than the low 10-June. So we have new lows with decreasing volume.
2) The following day we have high buy/green volume while prices move above EMA10 and EMA21. This is the volume we saw on the weekly timeframe.
3) The most revealing signal is the bullish divergence with the MACD:
4) The RSI hitting an ATL in late June but now trading above 40 is another giveaway signal...
We are likely looking at a bottom catch here, huge potential.
✔️ Remember the plan, if it goes below the last low/stop-loss/support, then out.
✔️ If it goes continues rising, strong upwards potential.
Low risk vs a really high potential for reward.
This is not financial advice.
Thank you for reading.
Namaste.

APE/BTC - APE: BBand_Breakout◳◱ A Bollinger Band breakout has been identified on the NYSE:APE / CRYPTOCAP:BTC chart. The price has moved outside of the upper Bollinger Band, indicating a potential bullish trend. The next resistance key levels are located at 0.0001267 | 0.00013127 | 0.00014261, and the major support zones can be found at 0.00011536 | 0.00010859 | 0.00009725. Consider buying at the current price zone of 0.00011958 and targeting higher levels.BBand_Squeeze
◰◲ General info :
▣ Name: APE
▣ Rank: None
▣ Exchanges: Binance, Hitbtc
▣ Category/Sector: N/A
▣ Overview: APE project overview is currently unavailable. I'll try to update this in the upcoming analysis.
◰◲ Technical Metrics :
▣ Mrkt Price: 0.00011958 ₿
▣ 24HVol: 11.041 ₿
▣ 24H Chng: 2.75%
▣ 7-Days Chng: N/A
▣ 1-Month Chng: N/A
▣ 3-Months Chng: N/A
◲◰ Pivot Points - Levels :
◥ Resistance: 0.0001267 | 0.00013127 | 0.00014261
◢ Support: 0.00011536 | 0.00010859 | 0.00009725
◱◳ Indicators recommendation :
▣ Oscillators: NEUTRAL
▣ Moving Averages: STRONG_BUY
◰◲ Technical Indicators Summary : BUY
◲◰ Sharpe Ratios :
▣ Last 30D: N/A
▣ Last 90D: N/A
▣ Last 1-Y: 3.17
▣ Last 3-Y: N/A
◲◰ Volatility :
▣ Last 30D: N/A
▣ Last 90D: N/A
▣ Last 1-Y: 35.33
▣ Last 3-Y: N/A
◳◰ Market Sentiment Index :
▣ News sentiment score is N/A
▣ Twitter sentiment score is N/A
▣ Reddit sentiment score is 0.23 - V. Bearish
▣ In-depth APEBTC technical analysis on Tradingview TA page
▣ What do you think of this analysis? Share your insights and let's discuss in the comments below. Your like, follow and support would be greatly appreciated!
◲ Disclaimer
Please note that the information and publications provided are for informational purposes only and should not be construed as financial, investment, trading, or any other type of advice or recommendation. We encourage you to conduct your own research and consult with a qualified professional before making any financial decisions. The use of the information provided is solely at your own risk.
▣ Welcome to the home of charting big: TradingView
Benefit from a ton of financial analysis features, instruments and data. Have a look around, and if you do choose to go with an upgraded plan, you'll get up to $30.
Discover it here - affiliate link -

#APE/BTC - Break with volumeDirection: Long
Market: Spot
Risk: 0.25% - 1%
#BTC_APE
Exchange: BINANCE
Timeframe: 360
TP1: 0.00013057
Entry: 0.00012541
STOP: 0.00012025
Entry Conditions:
| Breakout completed on long term trendline
| Volume confirmation
| CDV resistance break

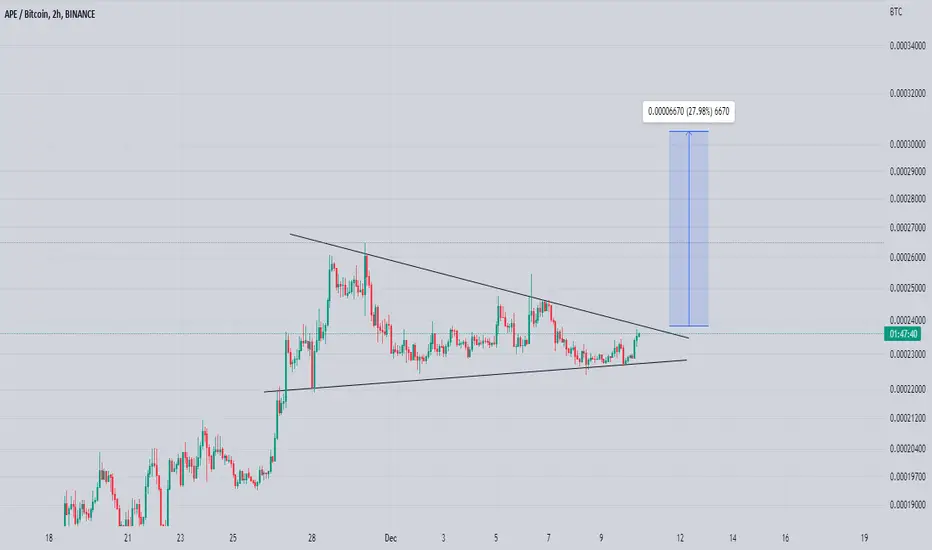
Apebtc On verge Of massive Breakout Formed Symmetrical Triangle In daily timeframe
Trying To Break To the Upside Incase Of Breakout expecting Massive Bounce
(note) Entry Will Be Valid Only After Breakout

APEBTC - Gaining momentum.!Next recovery on the line is APE coin vs Bitcoin!
It is already above the 0.236 Fibo resistance with acceptance above it..
I target the 0.5 of Fibo. and bonus target would be 0.786 of Fibo.!
Target 1 : 0.00022582
Target 2 : 0.00024515
Target 3 : 0.00029198
Stop : 0.00017994 (Previous low!)
Total no. of Analysis : 21
Successful trades : 12
NPNL : 4
Stop Hit : 4
Lost : 0
In Progress : 1

APE Already Moving Towards 111%+ (Update)We looked at APEBTC recently on the weekly timeframe, just two days ago... Here is the daily chart, it is already starting to move.
A break above EMA50 is really strong yet APEBTC is already growing above this level.
There is more to come.
See the previous chart: 24-Nov. | APE Bullish Bat Pattern Can Lead To 111%
Boost, Comment, Follow & Share!
Thanks a lot for your support.
Namaste.

APE Bullish Bat Pattern Can Lead To 111%For APEBTC, we can see a major correction from April to June that ended up forming a bullish bat pattern.
We have a major higher low mid-November and already two weeks of growth.
We have first an easy target at around 30%.
A major target can lead to 111% but it all depends on how the cryptocurrency market will behave.
A bullish wave market wide is coming, regardless of what happens in the short-term.
Remember to always plan before trading.
Do your own research... There is risk involved.
With a stop-loss the risk is controlled, say 10-20%.
But potential for growth is unlimited, especially when we trade with patience focused on the long-term.
Thank you for reading.
Thanks a lot for your continued support.
Stay tuned for more.
Namaste.

ApeCoin Bullish Breakout (Up To 180% Potential Mapped)We have multiple signals coming out of this chart that support a bullish case.
Bullish = Green.
The first one is a volume breakout.
We have above-average volume today as prices break above EMA50.
The second one is a break above EMA50.
Trading below EMA50 = bearish trend.
Trading above EMA50 = bullish trend.
The third one is the RSI.
Strong.
We have two targets here.
One can be fast, short-term at 45% more or less.
The second one mid-term can be 180%...
More details on the chart.
Namaste.

