APEUSDTAPEUSDT shows strong bullish momentum on the 1-hour chart, supported by MACD and RSI trends. However, the KDJ and Bollinger Bands suggest the asset is nearing overbought conditions, which could lead to a short-term pullback or sideways movement. Traders should watch for confirmation signals before making new entries.
Entry - 0.6647$
TP - 0.6769$
TP2 - 0.6561$
SL - 0.6582$
Always do your DOR (Research) before making a decision.
APEUSDT trade ideas

#APE/USDT Low Risk vs High Rewards#APE
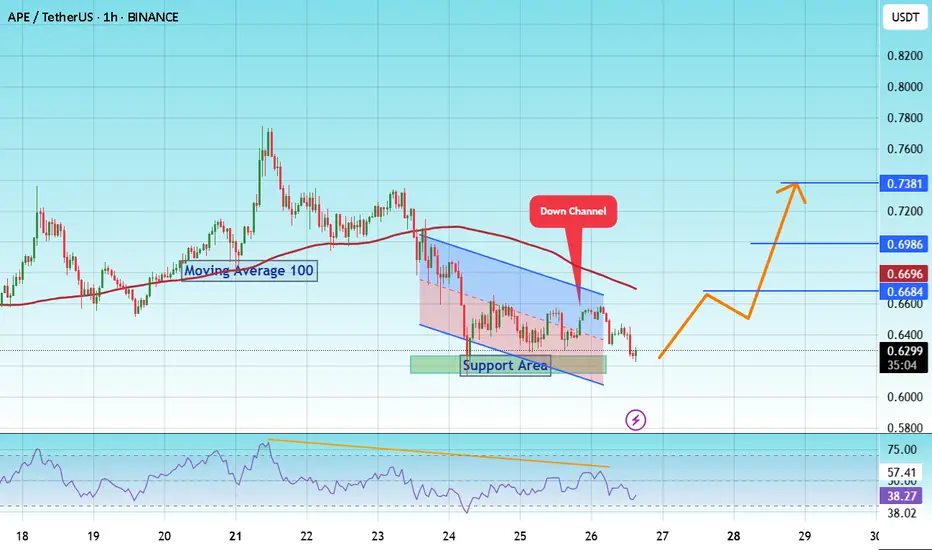
The price is moving within a descending channel on the 1-hour frame and is expected to break and continue upward.
We have a trend to stabilize above the 100 moving average once again.
We have a downtrend on the RSI indicator that supports the upward break.
We have a support area at the lower limit of the channel at 0.6080, acting as strong support from which the price can rebound.
We have a major support area in green that pushed the price upward at 0.6180.
Entry price: 0.6300
First target: 0.6633
Second target: 0.6986
Third target: 0.7380
To manage risk, don't forget stop loss and capital management.
When you reach the first target, save some profits and then change your stop order to an entry order.
For inquiries, please comment.
Thank you.
Apecoin Technical Analysis · New All-Time High & Easy TargetsAs I told you just recently, the moving averages can be used in different ways. The main way is to gauge the market bearish or bullish potential and this is the classic way. The second one, less conventional, is to know how advanced is a trading pair within the current cycle.
Before everything was growing, we would confirm a pairs bullishness by looking at EMA55, EMA89, EMA144, MA200, etc. But now that we have a confirmed bullish bias, we can use these same moving averages to see how much room there is left for growth. For example, here APEUSDT is trading below EMA55 weekly. This is great news. This reveals to us that this pair is still early. As we know the entire market will move upwards based on the classic four years cycle—a bull market every four years, or the fact that a bull market happens the year after Bitcoin's halving—catching a pair before a major breakout can be life changing, profits can be huge.
But we still need some bullish signals though so let's look at those. Apecoin moved below its August 2024 market bottom. This is bearish. Once the action is happening back above this long-term support level the bullish bias is confirmed. Currently, APEUSDT is trading above its August 2024 low.
Another good and strong bullish signal is the classic rounded bottom pattern. On the 7-April low a rounded bottom pattern formed to produce a reversal. Notice how the trading volume is much lower on the last low compared to previous action. If the market was set to continue lower long-term, the lowest point would have high volume. Lower lows with decreasing volume signals that the bearish trend is losing force. This is already confirmed here because Apecoin produced a higher low in June and has been closing green several weeks.
Technical analysis coupled with marketwide action. Apecoin is set to grow strong long-term.
Thank you for reading. I hope you find this information to your liking. I hope you make tons of profits in this bull market cycle and fulfill all of your goals. You are appreciated.
Namaste.

ApeCoin Quick Update —Moving Next#APE
The price is moving within a descending channel on the 1-hour frame, adhering well to it, and is heading for a strong breakout and retest.
We have a bounce from the lower boundary of the descending channel, this support at 0.5827.
We have a bearish trend on the RSI indicator that is about to be broken and retested, supporting the upside.
There is a major support area in green at 0.5600, which represents a strong basis for the upside.
Don't forget a simple thing: ease and capital.
When you reach the first target, save some money and then change your stop-loss order to an entry order.
For inquiries, please leave a comment.
We have a trend to hold above the 100 Moving Average.
Entry price: 0.6000.
First target: 0.6194.
Second target: 0.6378.
Third target: 0.6612.
Don't forget a simple thing: ease and capital.
When you reach the first target, save some money and then change your stop-loss order to an entry order.
For inquiries, please leave a comment.
Thank you.

Long APEUSDTBullish signal on APEUSDT
- Weekly divergence from RSI
- Reclaim daily resistance --> flip to support.
- Sentiment for crypto is bullish overall
Entry long at the pullback and target the above zones.
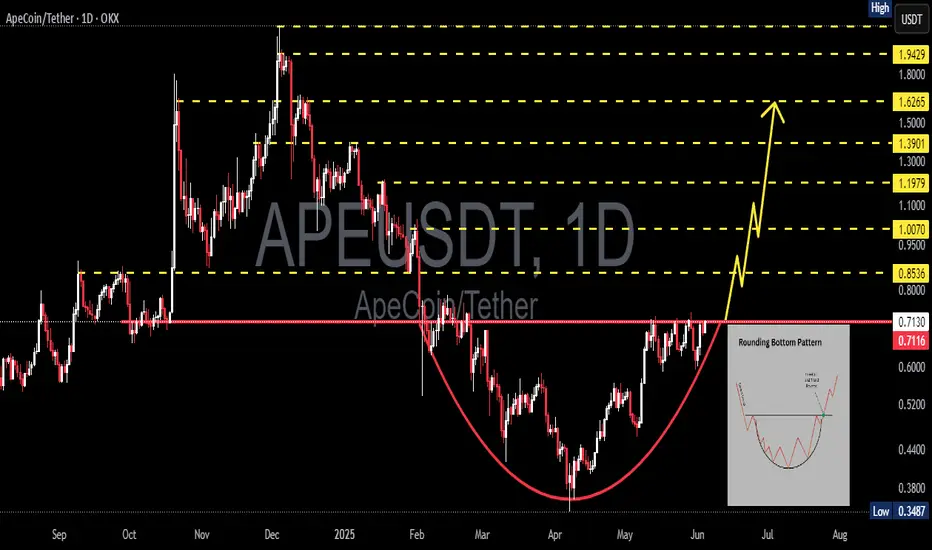
APEUSDT Poised for a Breakout! Cup & Handle Pattern Forming"Classic Pattern in a Bearish Market – A Big Move is Brewing!"
🧠 Technical Analysis Summary:
On the APE/USDT daily chart, we can clearly identify a Cup and Handle pattern, a classic bullish reversal structure that often signals the beginning of a significant rally. While many traders may be discouraged by the recent sideways movement, this formation indicates that smart money accumulation is happening quietly behind the scenes.
📌 Pattern Structure Breakdown:
🔴 The Cup:
Formed after a steep drop in late 2024, followed by a smooth rounded bottom that developed through May 2025.
The "U-shape" indicates a healthy recovery and accumulation phase, often seen before major trend reversals.
🟡 The Handle:
Currently forming a descending channel or bullish flag, representing a consolidation phase or "shakeout" before the next upward impulse.
This is typically the final dip before breakout in classic Cup & Handle formations.
📈 Key Resistance:
The yellow downward trendline is the neckline of the pattern.
A breakout above the $0.63–$0.65 zone will confirm the pattern and potentially spark a major move upward.
✅ Bullish Scenario (Upside Potential):
If a breakout is confirmed with strong volume and a daily candle closes above $0.65:
First target: $0.7452 (initial resistance)
Mid- to long-term bullish targets (measured from cup height):
🔹 $0.8658
🔹 $0.9934
🔹 $1.1931
🔹 $1.3804
🔹 $1.6171
🔹 $1.9585
🔹 $2.1669 → Main Cup & Handle Target
⏫ These targets are realistic if market sentiment turns bullish again and momentum builds.
⚠️ Bearish Scenario (Downside Risk):
If the breakout fails and price breaks down below the handle’s support zone:
Immediate support: $0.57 – $0.52
If $0.52 fails to hold:
🔻 $0.43
🔻 $0.3487 (Previous major low)
The pattern becomes invalid if the price breaks below the cup’s base at ~$0.43, suggesting bearish continuation.
📊 Additional Notes:
Volume is key. A valid breakout must be accompanied by a noticeable surge in trading volume.
Look for confirmation via RSI breakout or bullish divergence, and watch how price interacts with major moving averages.
Beware of false breakouts – a daily candle close above resistance with volume is the ideal confirmation.
💡 Final Thoughts:
APEUSDT is at a critical juncture. The nearly completed Cup and Handle pattern could be the launchpad for a major bullish rally. However, caution is advised—risk management and confirmation are essential for success in volatile crypto markets.
#APEUSDT #ApeCoin #CryptoBreakout #CupAndHandle #AltcoinAnalysis #TechnicalAnalysis #PriceAction #BullishCrypto #CryptoSetup #TradingSignal

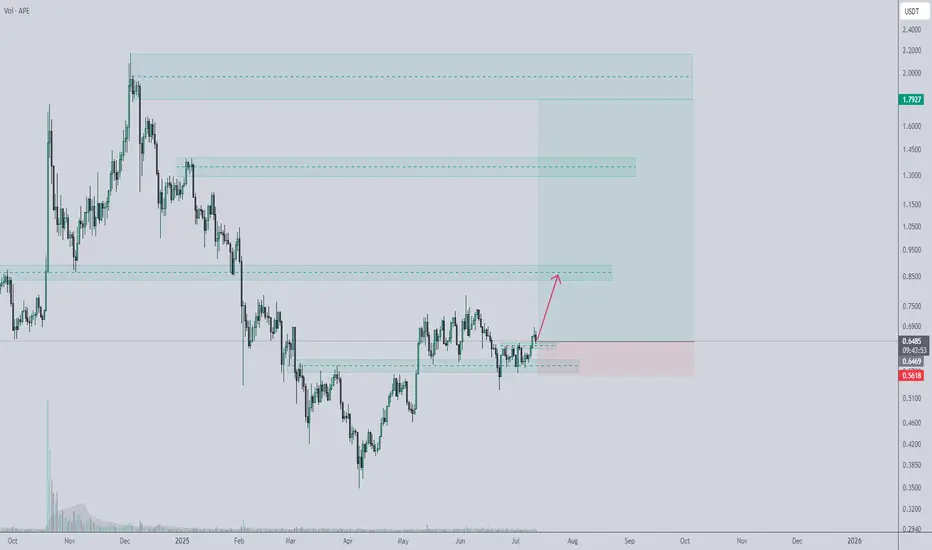
APE/USDT – Reversal Loading Below 0.6000APE is sitting on a major multi-timeframe support zone around 0.595–0.603. Structure already shifted on the weekly — this is no longer a clean downtrend. Price has reclaimed the 0.618 Fib and is now coiling below resistance.
Entries below 0.6000 are golden.
apeing in under 0.6000 and waiting for the upside move.
Upside targets: 0.626 → 0.726 → 0.798
Risk is clear: If 0.585 fails, we could revisit 0.543 or lower.
But if it holds, the upside move is likely to be fast, sharp, and hard to catch.
This is the kind of setup where price won't give second chances once it moves.
#APE #Crypto #SwingTrade #Reversal #Altcoins
Note: Not a Finanical Advice


Global trading plan for APEBINANCE:APEUSDT At the moment, the price has reached the monthly pivot points, and higher time frame indicators indicate further downside potential. Thus, the price could retest the local low, and once in the support area, we’ll determine the next objectives
In this video I considered the global possible price movement, also made possible scenarios for the current week
Write a comment with your coins & hit the like button and I will make an analysis for you
The author's opinion may differ from yours,
Consider your risks.
Wish you successful trades ! mura

APEUSDT: Trend in daily timeframeThe color levels are very accurate levels of support and resistance in different time frames, and we have to wait for their reaction in these areas.
So, Please pay special attention to the very accurate trend, colored levels, and you must know that SETUP is very sensitive.
Be careful
BEST
MT

APE/USDT"APE coin could potentially reach the current resistance level first, and then move toward the next targets. Let me know what you think!"

ApeCoin (APE) Cup Pattern (1D)After a deviation below demand, BINANCE:APEUSDT formed a clean rounded bottom, reclaimed the zone, briefly consolidated, and it's now attempting to break above resistance.
Key Levels
• $0.79: Current resistance
• ~$0.65: Current support, breaking it might lead to the formation of a handle
• $0.50-$0.60: Main demand zone and logical pullback target in case of a handle
• $1.20: Measured breakout target, and previous swing high
Worth watching it closely for a daily close above $0.79 with good volume to activate the target.
Alternatively, look at the $0.50-$0.60 area for a reversal in case of a rejection here.

TradeCityPro | APE: Key Breakout Watch in Gaming Token’s Range👋 Welcome to TradeCity Pro!
In this analysis, we’re taking a look at the APE coin — one of the prominent American gaming and metaverse projects that gained major traction during the last bull run.
⭐ Currently, APE holds a market cap of $540 million and ranks 110th on CoinMarketCap.
📅 Daily Timeframe
As shown on the daily chart, price has reached a key resistance zone and has tested it several times.
✔️ If this resistance breaks, it could confirm a trend reversal, potentially opening the way toward higher levels like 0.8990 and even 1.973.
🛒 For spot buying, an entry can be considered upon the breakout of this resistance, though it's safer to wait for confirmation of bearish momentum in Bitcoin dominance before entering a spot position on APE.
📈 However, for futures positions, this same breakout trigger can be used — either on the daily chart or lower timeframes.
🔽 On the short side, a support level has formed at 0.6073. A break below this could extend the bearish trend toward 0.3833.
⚡️ Still, there’s a major support level nearby at 0.5633. If you’re looking for a more conservative short entry, you might wait for a clean break below 0.5633.
💥 Momentum confirmation for the short position would come with an RSI breakdown below 46.46, which would signal stronger bearish pressure entering the market.
📝 Final Thoughts
This analysis reflects our opinions and is not financial advice.
Share your thoughts in the comments, and don’t forget to share this analysis with your friends! ❤️

APEUSDT 1D AnalysisAPE ~ 1D Analysis
#APE This trade is very risky
Buy after successfully breaking this resistance line with strong volume. With a short-term target of at least 15%+.
ApeCoin (APE) Forming a Bullish Reversal?📈 Key Levels to Watch (Daily + 4H Technical Analysis)
On the daily timeframe, ApeCoin (APE) is forming a clear inverse head and shoulders pattern near the bottom of the chart — a classic bullish reversal signal. A confirmed breakout above the $0.7106 resistance level could mark the beginning of a new uptrend.
Currently, APE is trading within a consolidation box, offering potential for both breakout and breakdown plays:
⚠️ A break below $0.5950 may open up a short opportunity,
But due to the lack of a strong bearish trend, quick profit-taking on shorts is strongly recommended.
---
📉 4H Chart Insights:
Downward moves are occurring on declining volume, while upward pushes toward $0.7106 are happening with increased volume, suggesting that bulls have more conviction than bears.
If RSI breaks above 80 on the 4H chart, it could serve as a secondary confirmation of renewed bullish momentum.
---
💡 Trading Strategy:
This zone is attractive for both spot entries and futures setups:
For futures, a dynamic stop-loss can be placed around $0.6722, subject to market volatility.
For spot traders, a more conservative stop-loss would be around $0.5891.

ApeCoin Quick Update —Moving NextWe looked at ApeCoin recently and I was certain this pair was set to move forward... What happened? Nothing really. Look at the action the last five days. The three red days were a nothing, just a small retrace and sideways consolidation. Now we are full green again.
I mentioned how the top performers will change now in this newly developing bullish continuation, there is more. The first wave peaked after 100 and 300% profits, the second wave will be between 200 and 500% profits for each pair on average. Awesome isn't it?
» Then there will be even more so this is only the start.
This is a timing based publication. APEUSDT is set (likely) to move next.
Note. Remember, it can always take longer than expected but the bigger picture doesn't change. It is going up. Buy and hold. The market takes care of the rest.
Namaste.

APEUSDT: Approaching Key Resistance in Descending ChannelThe asset continues to trade within a broad descending channel. Currently, the price is approaching the upper boundary, sitting near the channel’s median line — a key level that often acts as support or resistance.
Locally, a potential bullish flag pattern is forming, pointing toward the resistance zone. A breakout above this channel boundary could trigger a trend reversal to the upside.
Long targets are marked on the chart. Keep in mind the alternative scenario: a rejection at resistance and a possible return to the channel’s lower boundary remain valid.
Always practice proper risk management
The asset is traded on multiple liquid exchanges, including Coinbase, which adds optimism to its potential outlook.

#APEAped in small size position here based off gut feeling, only 1% risk atm will add up once we have follow through

ApeCoin 369% Target Explained —Altcoins 2025 Bull MarketThis is an interesting pair. The entire Altcoins market is waking up now and gaining in bullish momentum. I just want to show you the target.
From the April bottom to present day, Apecoin has grown by ~100%, which is nice, solid, but there is great potential for additional growth.
The second target at 369% from current price, at the time of writing, would yield more than 840% from the April bottom. So if this isn't the 2025 all-time high, which I believe won't be, then the total growth potential for this bullish cycle is astonishing. It will be huge.
So far we continue to see and experience slow and steady growth, but soon, the Altcoins market will produce amazing growth. It will be something to experience, it is good now to buy and to hold LONG.
Namaste.

#APEUSDT Analysis — Testing Bottom of the Channel📉 #APEUSDT Analysis — Testing Bottom of the Channel
🗓 Published: April 23, 2025
🕰 Timeframe: 1W | 📊 Exchange: Binance
🔍 Technical Overview
APE is currently sitting near the lower boundary of a descending channel that has been in play since mid-2023. Historically, this zone has offered short-term bounce opportunities when tested.
📌 Structure:
✅ Long-term Falling Channel
✅ Testing lower support line
✅ Previous bounces from this area led to 2x–3x moves
🔻 Panic Level (Invalidation Zone)
📉 $0.2793
A weekly close below this level would invalidate the current bounce scenario and could lead to a sharp capitulation phase.
🎯 Upside Targets (If Bounce Confirmed):
Resistance 1: $0.8688 — First major horizontal level
Resistance 2: $1.6642 — Upper channel resistance zone
📈 If market conditions support it, this bounce could extend toward the channel top for a potential +200% gain.
🧠 Strategy Insight
APE is deeply oversold on higher timeframes and testing historical low levels within a well-defined downtrend channel.
🔎 Early buyers may look to scalp the bounce, but safer entries require confirmation above $0.60–$0.70 zone.
💡 Play this as a bounce trade, not a breakout — unless price reclaims $1+ with volume.
🗣 What’s Next?
Watch for weekly confirmation candles. If we get bullish divergence or reclaim MA resistance, APE could be one of the top rebounders this cycle.
📢 Oversold. Unloved. But technically primed. APE might surprise again.
Please keep in mind that this is not financial advice and the purpose of these charts is to provide an idea of coin movement, not buy or sell signals. The cryptocurrency market is highly volatile and not suitable for everyone, so be aware of the potential risks before making any investment decisions. The information presented here is a personal effort and is subject to success or failure, and we welcome constructive criticism.
Good luck to all.
🙏we ask Allah reconcile and repay🙏

APEUSDT 1D#APE has broken the descending resistance to the upside and has formed a Rounding Bottom pattern on the daily chart. Consider buying it near the support and the daily EMA50. In case of a breakout above the neckline, the targets are:
🎯 $0.8577
🎯 $0.9779
🎯 $1.1490
🎯 $1.3670
⚠️ Use a tight stop-loss.

Buy apeusdtPrice is previously bullish, retested a major support zone and formed an inverse head and shoulders pattern with a break and a retest of the neckline.

ApeCoin Uptrend Points To 438% Mid-Term TargetThe black lines are the bottom lines. The action below the lower black line is the actual bottom. ApeCoin (APEUSDT) trading above the higher black line is 100% bullish zone bullish confirmed. You see on the chart the development of an uptrend, it is already underway.
Orange = downtrend. 5 months. December through April.
Right side = uptrend. ~8 months. April through late 2025.
The duration of the uptrend can vary of course, can be much longer or shorter. What we can know for sure is that market conditions have changed. We are 100% bullish now. Cryptocurrency is bullish now. The Altcoins are bullish now. ApeCoin has been growing for more than a month.
» Easy target on the chart 438% with more long-term. This one can hit within 1-3 months (mid-term).
Thank you for reading.
Namaste.
